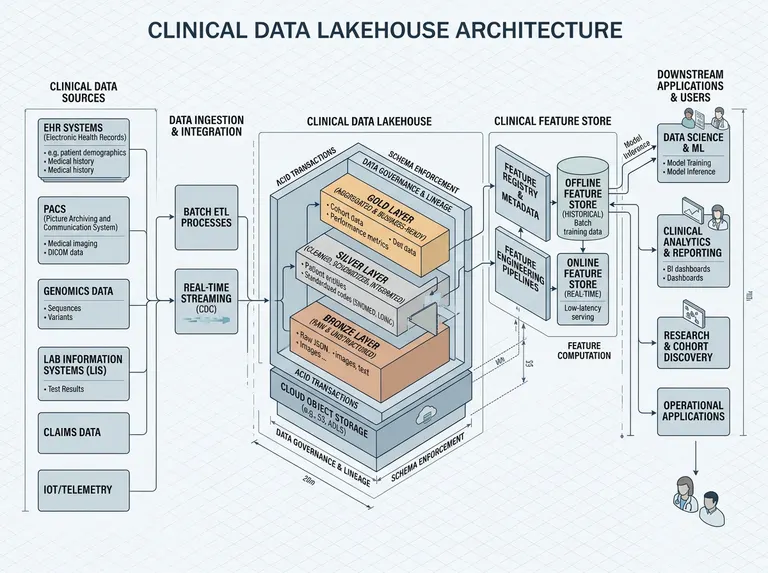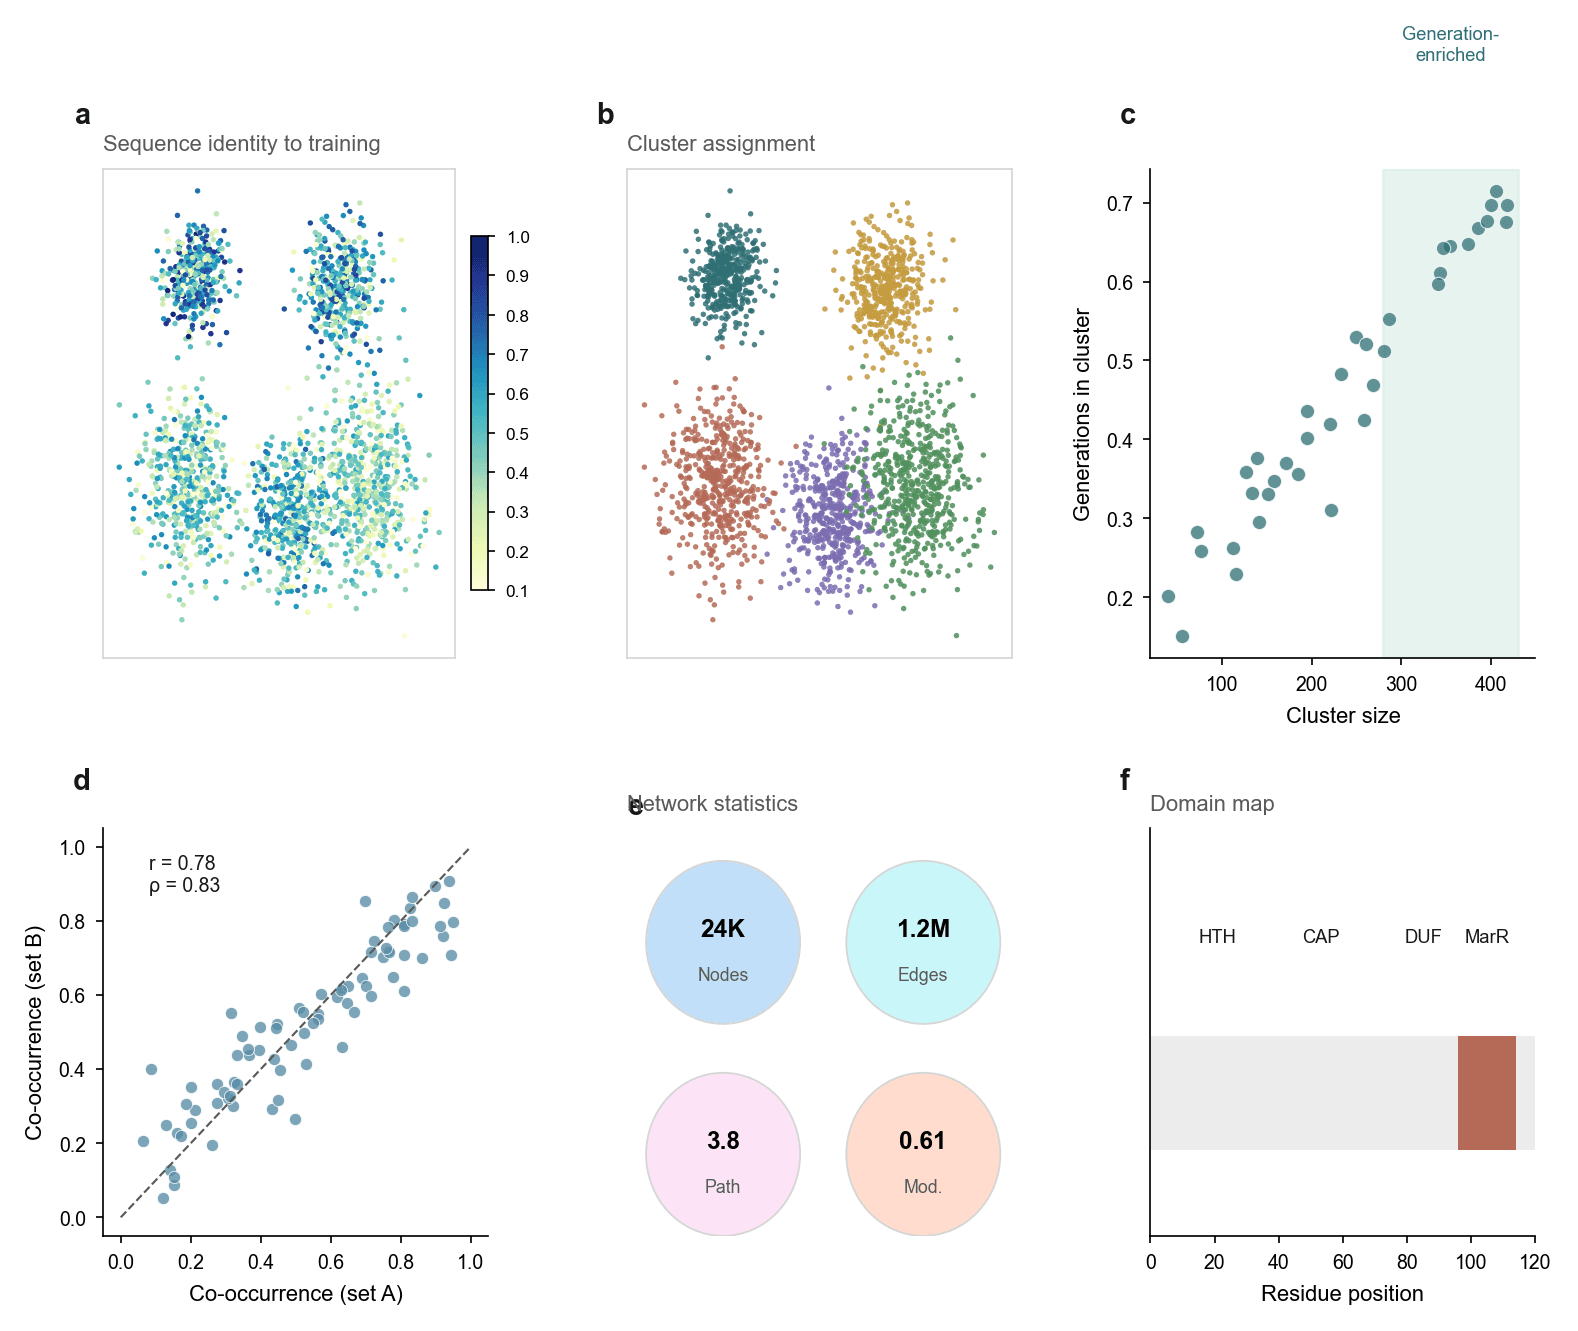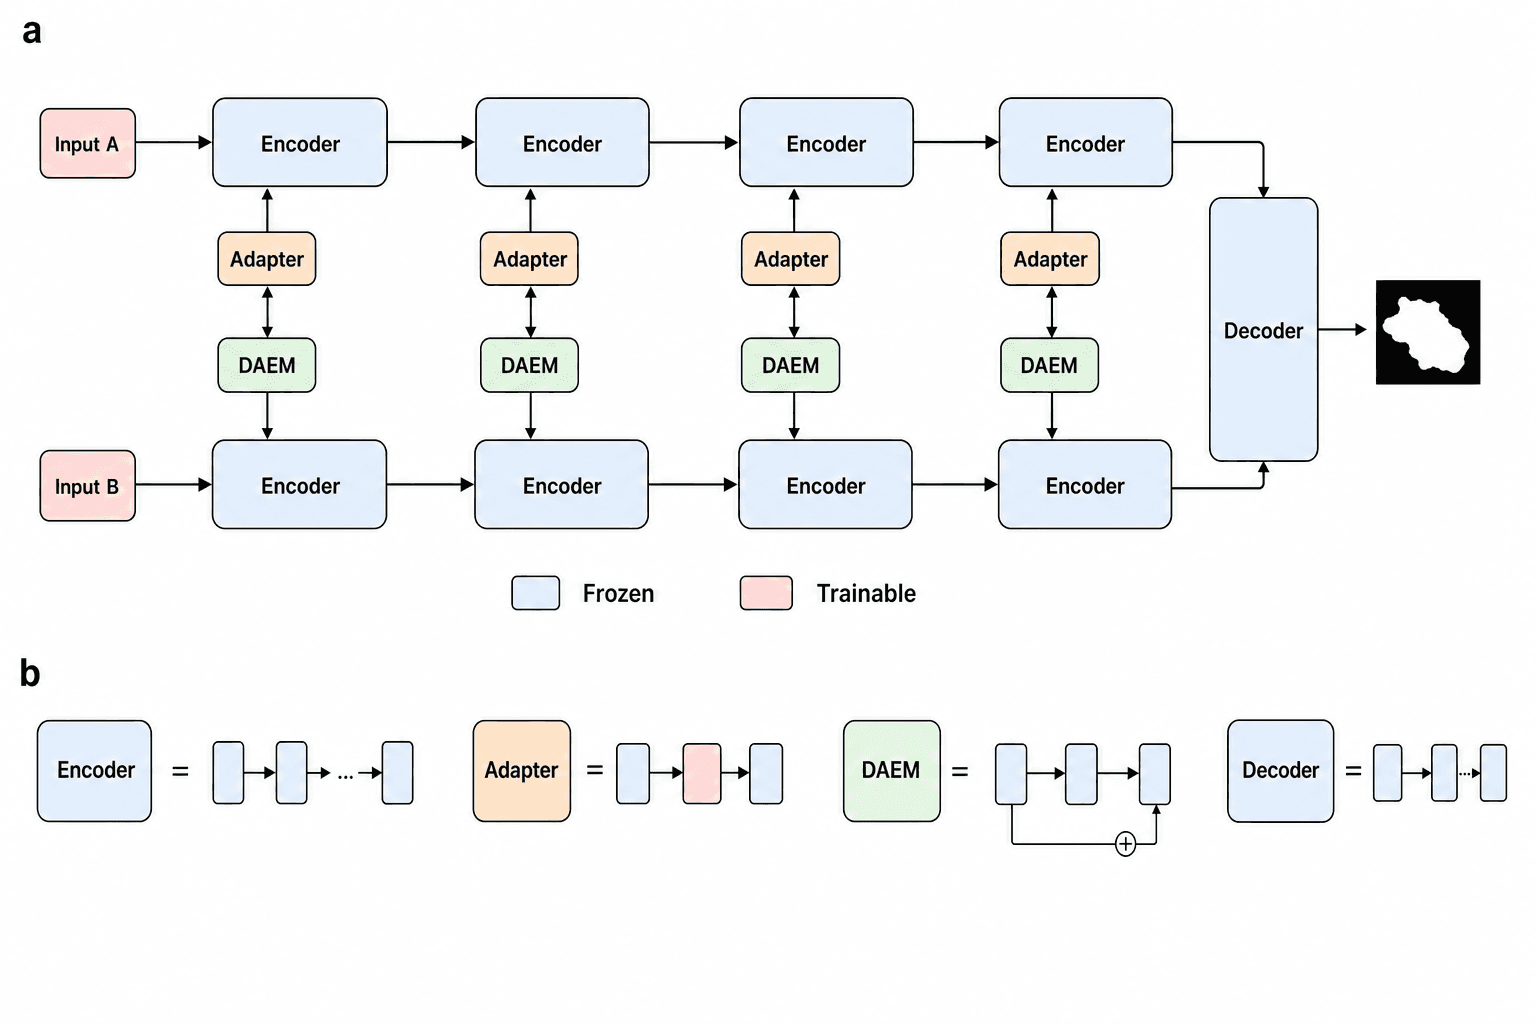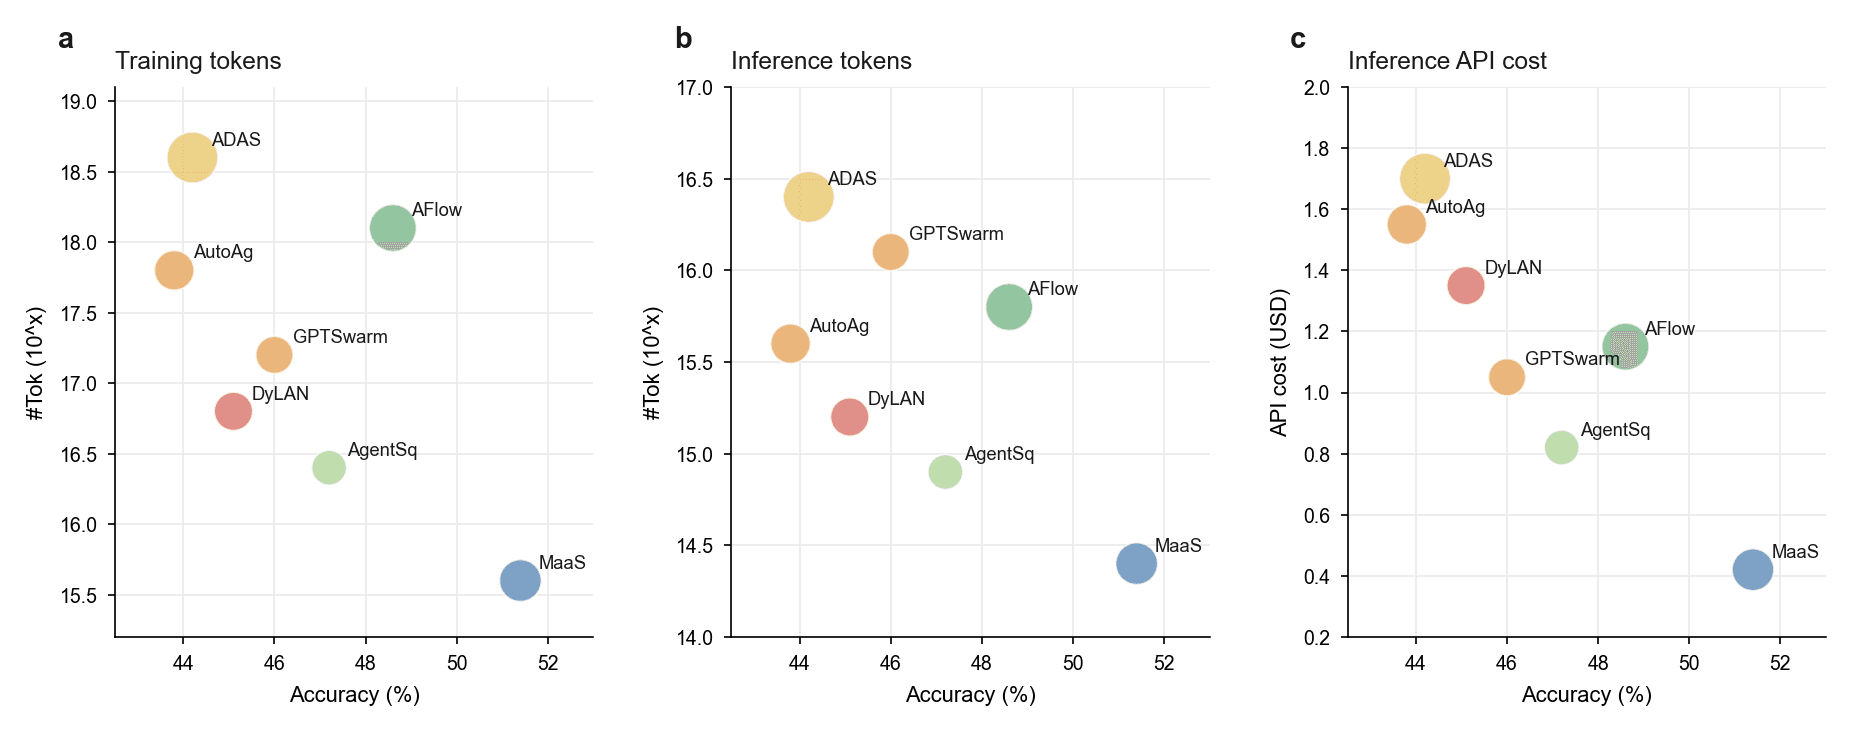
Figure template · System & Network · 4:3
Edge-to-Cloud IoT Monitoring Architecture
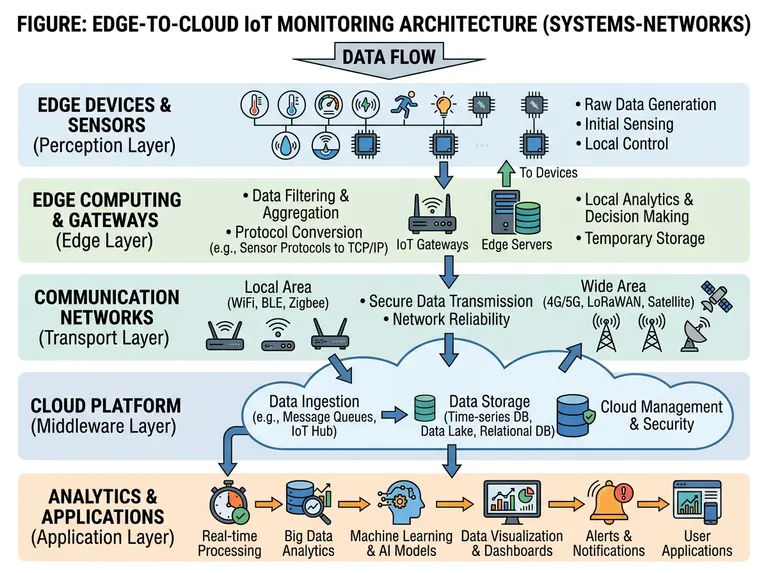
A landscape system diagram of five stacked bands that runs from sensors in the perception layer to alerts and dashboards in the application layer, naming each layer on the left and its duties on the right, for engineering papers and project proposals.
Prompt
Create a scientific figure about: IoT monitoring architecture from edge sensors to cloud analytics. Visual style: Clean Vector. Requirements: publication-ready scientific quality, clear labels and directional arrows where appropriate, avoid cartoon or stock-photo look, composition optimized for research papers and academic slides.
What this template is
The perception layer holds sensors for temperature, humidity, pressure, energy, motion and light, wired to microcontrollers that generate raw data and handle local control. Gateways and edge servers then filter and aggregate readings, convert sensor protocols to TCP/IP, make local decisions and send commands back to devices. A transport layer splits into short-range local links and cellular, low-power wide-area and satellite links. The cloud platform ingests data through message queues, stores it and manages security, and the application layer runs from real-time processing through machine learning to dashboards, alerts and user apps. A reader should see where data is reduced and where decisions are made.
Elements to label
Data flow banner
The large downward arrow at the top, labelled as data flow, telling readers to take the five bands from top to bottom.
Perception layer sensors
A row of sensor icons naming the measured quantities, with raw data generation and local control written beside them.
Edge gateways and servers
Caption the gateway with filtering, aggregation and protocol conversion, and the server with local analytics and temporary storage.
Downlink control arrow
The arrow from edge server back to devices, labelled as commands and coloured differently from the upward data flow.
Local and wide-area networks
Short-range wireless on the left, cellular and satellite links on the right, secure transmission and reliability in between.
Cloud platform
Ingestion, storage, and management with security as three blocks, the storage block listing time-series, lake and relational stores.
Application pipeline
Six nodes from real-time processing to user applications, chained by arrows in the order the data is handled.
Layer names
Each band carries its plain name on the left with the conventional term, such as perception or edge layer, in brackets.
Where it is used
- Paper mechanism figure
- Grant proposal
- Defense slides
- Course handout
What reviewers look for
Security appears only in the cloud
The sample writes security on the cloud platform alone. Device authentication, link encryption and gateway firmware updates are absent, and engineering reviewers usually ask what protects each layer, not only the last one.
Latency and where decisions happen
Both the edge and the cloud are labelled with analytics, so a reader cannot tell which alarms fire locally and which need the cloud. Give the latency requirement for each path in the legend.
The wide-area arrow points the wrong way
An arrow runs from the cloud up to the wide-area towers, as if the cloud were the data source. If the link is bidirectional, draw a double-headed arrow and say what travels downstream.
A gallery label in the title
The sample title begins with a FIGURE prefix and ends with a gallery category in brackets. Remove both before submission and use your system's name or move the description into the legend.
How to use it in Yila
- 1Pick a figure
- 2Describe your subject and the steps to stress
- 3Refine it in chat, then download the PNG
Tips
Do
- Name your real sensors and setting, such as bridge structural health or greenhouse climate, so the icon row shows the quantities you measure.
- If your system closes a control loop locally, ask Yila to extend the downlink arrow to the actuators and mark the owning layer.
- Ask for the data volume or sampling rate at each layer to be written as text if your paper argues that edge filtering saves bandwidth.
Avoid
- Do not crowd the network band with protocol names; keep the one or two links your deployment actually uses.
- Do not give all six application nodes equal weight when your contribution is one of them, such as anomaly detection; enlarge that module.
Questions
Can this architecture diagram go straight into my paper?
Treat it as a first draft of your system overview. It is an AI-generated image whose title still carries a gallery category label and whose wide-area arrow points the wrong way, so correct those details and keep refining it in chat until it matches the journal's figure style.
Can I swap the blocks for the components of our system?
Not element by element, but you can keep refining it by chatting in Yila. List your sensors, gateways, links and platform services, and it will place them in the same five-layer structure and generate a new version for you to review.
What format is delivered?
An AI-generated PNG image in a 4:3 landscape frame, suited to papers, proposals and presentation slides. It is not a vector graphic, and the small captions under the icons soften when enlarged, so check legibility at the size you plan to use.
Do I need to pay?
Browsing this page and the sample costs nothing. Generating and editing in Yila consumes credits, and a new account receives 2,500 credits, enough to rework the diagram for your own deployment several times, for example once per field site you describe.
Can it show a digital twin or a closed control loop?
Describe it in the conversation, for instance a digital twin beside the cloud platform whose predictions travel back through the edge layer to actuators, and it will add the loop arrows and label what each layer contributes to the cycle.
Does it work as a technical roadmap in a proposal?
Yes. The five bands map naturally onto what a project will build, and you can ask it to tag each band on the right with the corresponding work package or milestone so the figure echoes the structure of the proposal text.