Figure template · System & Network · 4:3
Multi-Source Integrated Energy System Schematic
Three dashed panels read left to right, from energy sources through conversion and storage to the user side, with blue, green, red and cyan arrows separating electricity, gas, heat and cooling. Suited to microgrid and district energy papers.
Prompt
Create a scientific figure about: Multi-source IES with conversion, storage, and V2B demand. Visual style: Clean Vector. Requirements: publication-ready scientific quality, clear labels and directional arrows where appropriate, avoid cartoon or stock-photo look, composition optimized for research papers and academic slides.
What this template is
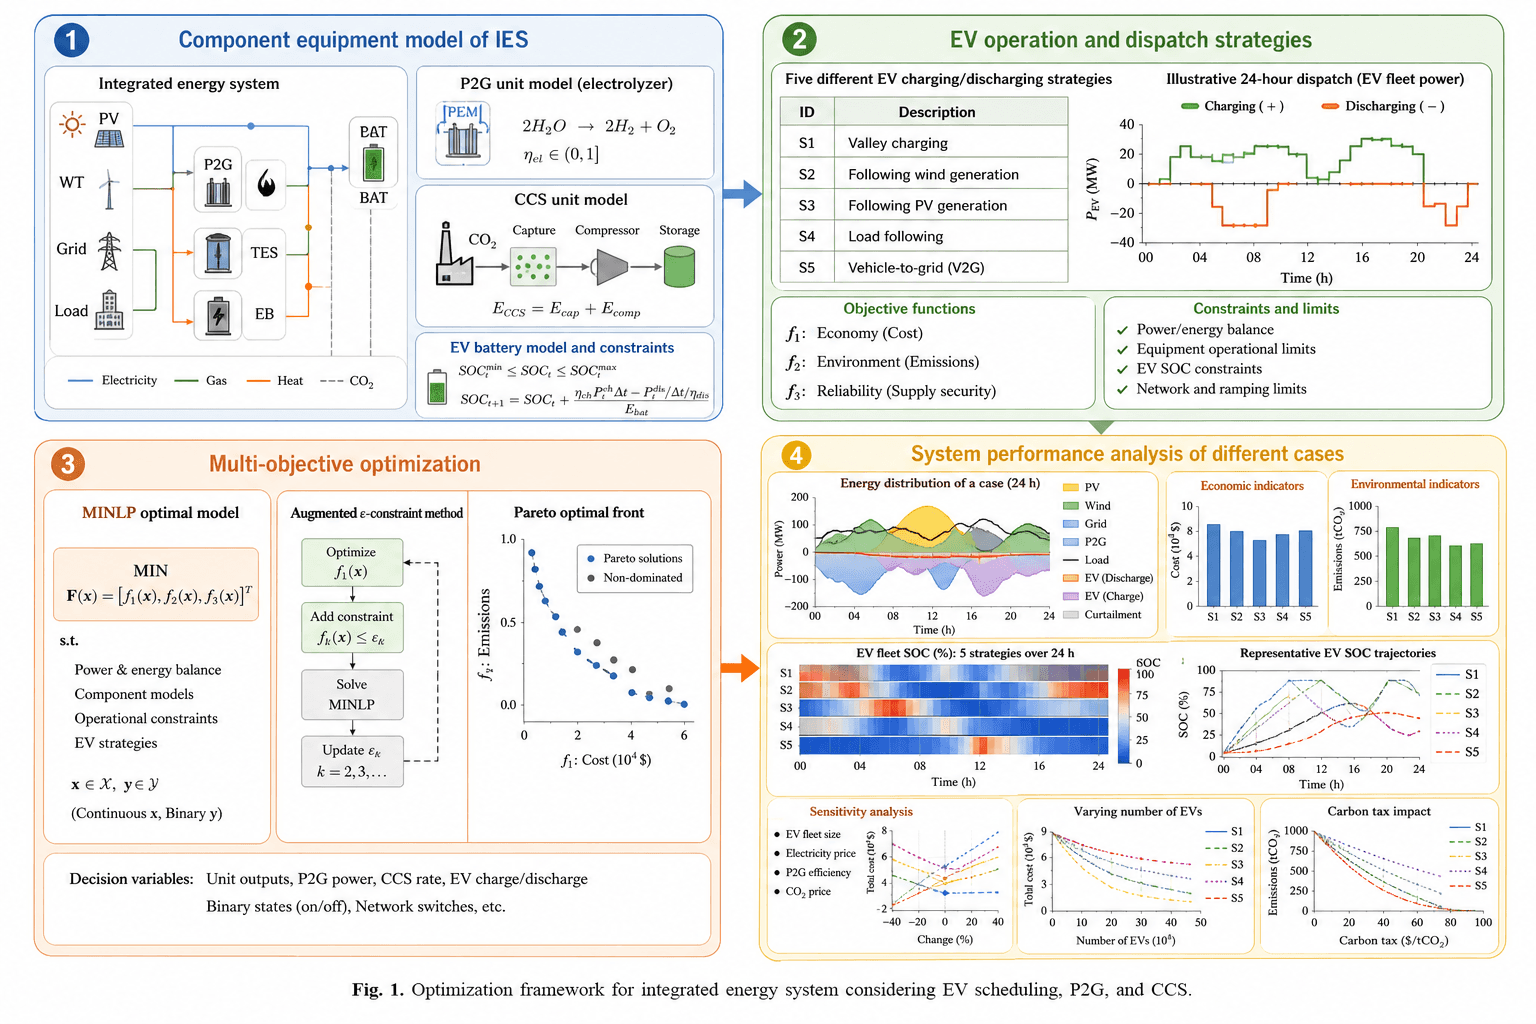
The schematic lays out a district-scale integrated energy system. The source panel holds wind and solar, the grid, geothermal supply and natural gas. The conversion panel contains photovoltaics, a wind turbine, batteries, an internal combustion engine, carbon capture, power-to-gas, an absorption chiller, thermal storage tanks and a ground-source heat pump. The user side pairs an electric vehicle charger with a building that draws electricity, gas, heat and cooling. A reader should come away seeing how one energy carrier is turned into another, where storage buffers sit along the way, and how parked vehicles can discharge into the building.
Elements to label
Source panel
A green box at far left listing wind and solar, grid, geothermal and natural gas, each under its own icon.
Electricity bus
A blue line crossing the conversion panel; PV, the turbine and the battery join it at dots before it reaches the user side.
ICE, CCS and P2G chain
Three units on the green gas line; keep the abbreviations short and spell them out in the caption.
Thermal storage
HST and HTS tanks on red heat lines; mark charging and discharging directions, and merge the names if they are one device type.
Absorption chiller and heat pump
The AC unit takes red heat and sends cyan cooling to the building; the GSHP sits at the bottom with its ground loop.
Vehicle-to-building link
A charger and car with vertical double arrows labelled V2B, showing the vehicle can feed power back.
Building loads and legend
Four inlets on the building for electricity, gas, heat and cooling, coloured to match the legend strip below.
Conversion boundary
A dashed blue frame labelled Conversion; anything outside it is a source or a load, which mirrors how constraints are grouped in the model.
Where it is used
- Paper mechanism figure
- Defense slides
- Grant proposal
- Academic poster
What reviewers look for
Inputs and outputs of each unit
In the sample a PV electricity arrow runs into the combustion engine, which should burn gas and deliver power and waste heat. Reviewers trace what every unit consumes and produces.
Carbon and hydrogen streams
The CCS-to-P2G link should state that it carries captured CO2, and methanation also needs electricity and H2 input; label each of those streams beside its arrow so the carbon balance can be followed.
Overlapping storage labels
HST, HTS and BST are easy to confuse, and the BST battery icon receives a heat line. Make sure each abbreviation maps to one device and is defined in the caption.
Where V2B power goes
The V2B arrows are not wired to the building or the bus, so a reviewer will ask how discharged power enters the load. Draw that connection explicitly.
How to use it in Yila
- 1Pick a figure
- 2Describe your subject and the steps to stress
- 3Refine it in chat, then download the PNG
Tips
Do
- Replace the units with the ones your dispatch model actually optimizes, keeping the three-panel source, conversion and user layout.
- Define every abbreviation in the caption, from ICE and CCS to P2G, HST and GSHP.
- If your study prices carbon, ask Yila to draw carbon flows with a separate line style.
- Add a unit label such as kW or kWh of heat to each flow type so reviewers can match lines to model variables.
Avoid
- Showing the ground-source heat pump in both the source and conversion panels, which suggests two separate machines.
- Keeping the PV-to-engine arrow from the sample; that energy flow does not make physical sense.
Questions
Can this energy system schematic go straight into a paper?
Treat it as a starting draft rather than a finished figure. It is an AI-generated illustration, and some flow directions and storage names need correcting. Check every unit, every arrow and every abbreviation against your optimization model and its equations before you submit it.
Can I remove units or add hydrogen storage?
The image is not editable element by element and is not a vector graphic. Describe the change in a Yila chat, for instance dropping the engine and adding an electrolyser with a hydrogen tank, and the whole schematic is regenerated.
What format do I get?
An AI-generated PNG image in a 4:3 landscape frame, which suits a slide or a full-width figure in a two-column paper. If the venue requires vector art, use the panel layout as a guide and redraw it in your drawing software.
Is it free?
Viewing this page and the sample costs nothing. Generating the figure in Yila, and each revision after that, consumes credits. New accounts receive 2,500 credits, enough to make a first version and then adjust the equipment mix.
Can the electricity, heat and gas networks be shown as separate panels?
Yes. Ask Yila to split the system into one panel per carrier and join the panels through the coupling units, such as the engine, the chiller and power-to-gas. That layout explains multi-energy coupling constraints well, though it takes more page space than a single schematic.
Can I get a simpler version for a thesis defense?
Ask Yila to keep only PV, the wind turbine, the battery, thermal storage and the building loads, and to drop carbon capture and power-to-gas. Fewer units means each icon stays legible on a projector, while the detailed version can live in the paper or its appendix.