Figure template · System & Network · 4:3
EV Fleet Dispatch with Power-to-Gas and Carbon Capture
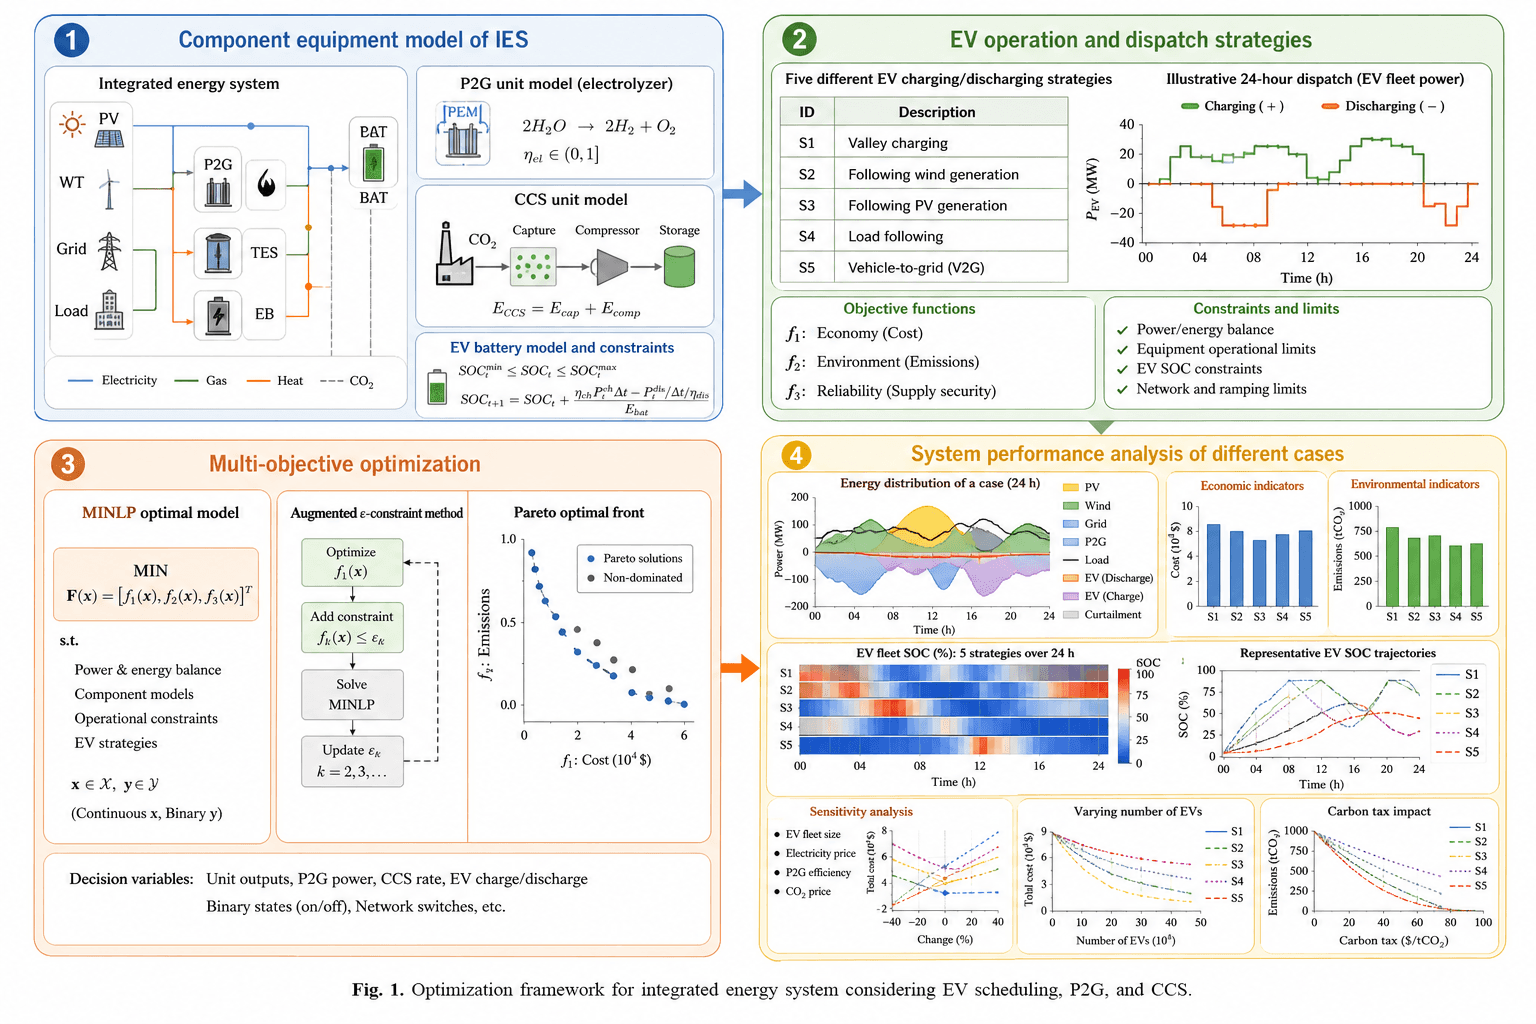
Three columns answer three questions in turn: how the fleet is dispatched over a day, how electricity and carbon are converted, and what the system achieves. An icon legend along the foot keeps water, carbon dioxide, hydrogen and methane consistent.
Prompt
Create a scientific figure about: EV fleet dispatch with P2G–CCS conversion pathways. Visual style: Clean Vector. Requirements: publication-ready scientific quality, clear labels and directional arrows where appropriate, avoid cartoon or stock-photo look, composition optimized for research papers and academic slides.
What this template is
The figure puts vehicle flexibility and power-to-gas conversion on one page. On the left, a Gantt chart shows individual vehicles charging, discharging or idling across a day, summarized as an aggregated fleet power profile. In the middle, surplus renewable electricity splits water into hydrogen, which reacts with captured carbon dioxide to form synthetic methane, while the remaining carbon dioxide is transported and stored underground. On the right, a cost-versus-emissions frontier and a fleet state-of-charge heatmap report the outcome. A reader should see where the flexibility comes from, where the carbon ends up, and how the trade-off is measured.
Elements to label
Fleet dispatch Gantt chart
One row per vehicle with green charging, orange discharging and grey idle bars running across a full-day time axis.
Aggregated power profile
A filled area curve in per-unit terms, positive for charging and negative for discharging, beneath the Gantt chart.
Electrolysis stage
Water enters the electrolyser and hydrogen leaves it, with renewable electricity joining as a dashed supply line.
Methanation reactor
A box carrying the reaction that turns hydrogen and carbon dioxide into methane and water, feeding the synthetic methane output.
Capture and storage loop
Carbon dioxide runs from capture through transport into geological storage, drawn as the dashed carbon loop.
Outputs and by-products panel
A dashed box listing hydrogen and synthetic methane as products, recovered water as the by-product, and permanently stored carbon.
Cost versus emissions frontier
A descending curve of solutions with an arrow marking the Pareto-optimal region; keep both axis units matched to your model.
State-of-charge heatmap
Vehicles on the vertical axis and time on the horizontal one, shaded by percentage and sharing the dispatch chart's clock.
Where it is used
- Paper mechanism figure
- Defense slides
- Grant proposal
- Academic poster
What reviewers look for
Energy flow versus mass flow
The middle legend assigns green to energy flow and blue to mass flow, yet the water inlet and the hydrogen outlet are both drawn in blue. Check each line against the legend before the figure is reused.
Where the captured carbon goes
Captured carbon dioxide is split between methanation and geological storage, and that ratio decides the net emissions of the whole system. Give the split and the accounting boundary in the figure or in the text.
Dispatch and state of charge agreeing
A vehicle shown discharging in the Gantt chart should lose state of charge at the same hours in the heatmap. Panels drawn from different cases contradict each other, and reviewers notice quickly.
Provenance of the plotted values
The frontier and the aggregated power profile are illustrative. Replace them with your optimization results and report the case size, time resolution and solver used to obtain them.
How to use it in Yila
- 1Pick a figure
- 2Describe your subject and the steps to stress
- 3Refine it in chat, then download the PNG
Tips
Do
- Give the Gantt chart and the heatmap the same vehicle rows and the same time axis, so the two panels can be read together.
- Label efficiency or conversion rate beside the electrolyser and the methanation reactor.
- Replace both right-hand panels with the frontier and state-of-charge profile your own model produced.
- Keep the foot legend's icons for water, carbon dioxide, hydrogen and methane matched to the symbols used in your equations.
Avoid
- Keeping the sample cost and emission values, which rest on no model or case study at all.
- Drawing energy flows and mass flows with the same line style, which makes the legend at the foot useless.
Questions
Can this go straight into a paper as the system framework figure?
Use it as a draft. It is an AI-generated illustration, the dispatch bars and result curves are placeholder data, and some lines disagree with the flow legend. Swap in your own case results and check every connection before you submit it.
Can I change the conversion pathway or add hydrogen storage?
The image is not editable element by element and is not a vector graphic. Keep chatting in Yila, for example add a hydrogen tank before methanation or replace storage with carbon utilization, and the whole figure is regenerated around your description.
What format is delivered?
An AI-generated PNG image in a 4:3 landscape frame. The three-column structure suits a full-width paper figure or a whole slide; if the journal requires vector output, redraw it in your drawing software keeping the same column split.
Is it free?
Viewing this page and the sample costs nothing. Generating the figure in Yila, and every revision after that, consumes credits. New accounts receive 2,500 credits, which covers a first version and several rounds of adapting the columns to your case study.
Can I keep only the middle conversion pathway?
Yes. Ask for electrolysis, methanation and the capture-and-storage loop alone. The type grows noticeably larger, which helps when you walk an audience through the chemistry step by step, leaving the dispatch chart and the result panels for later slides.
Can the right-hand plots show my optimization results?
Generated curves only follow the trend you describe, and their axis values cannot be trusted. Plot the real frontier and heatmap in your usual charting tool, then combine them with the pathway part of this figure when assembling the final version.