Figure template · System & Network · 4:3
Co-Scheduling EVs and Storage in an Integrated Energy System
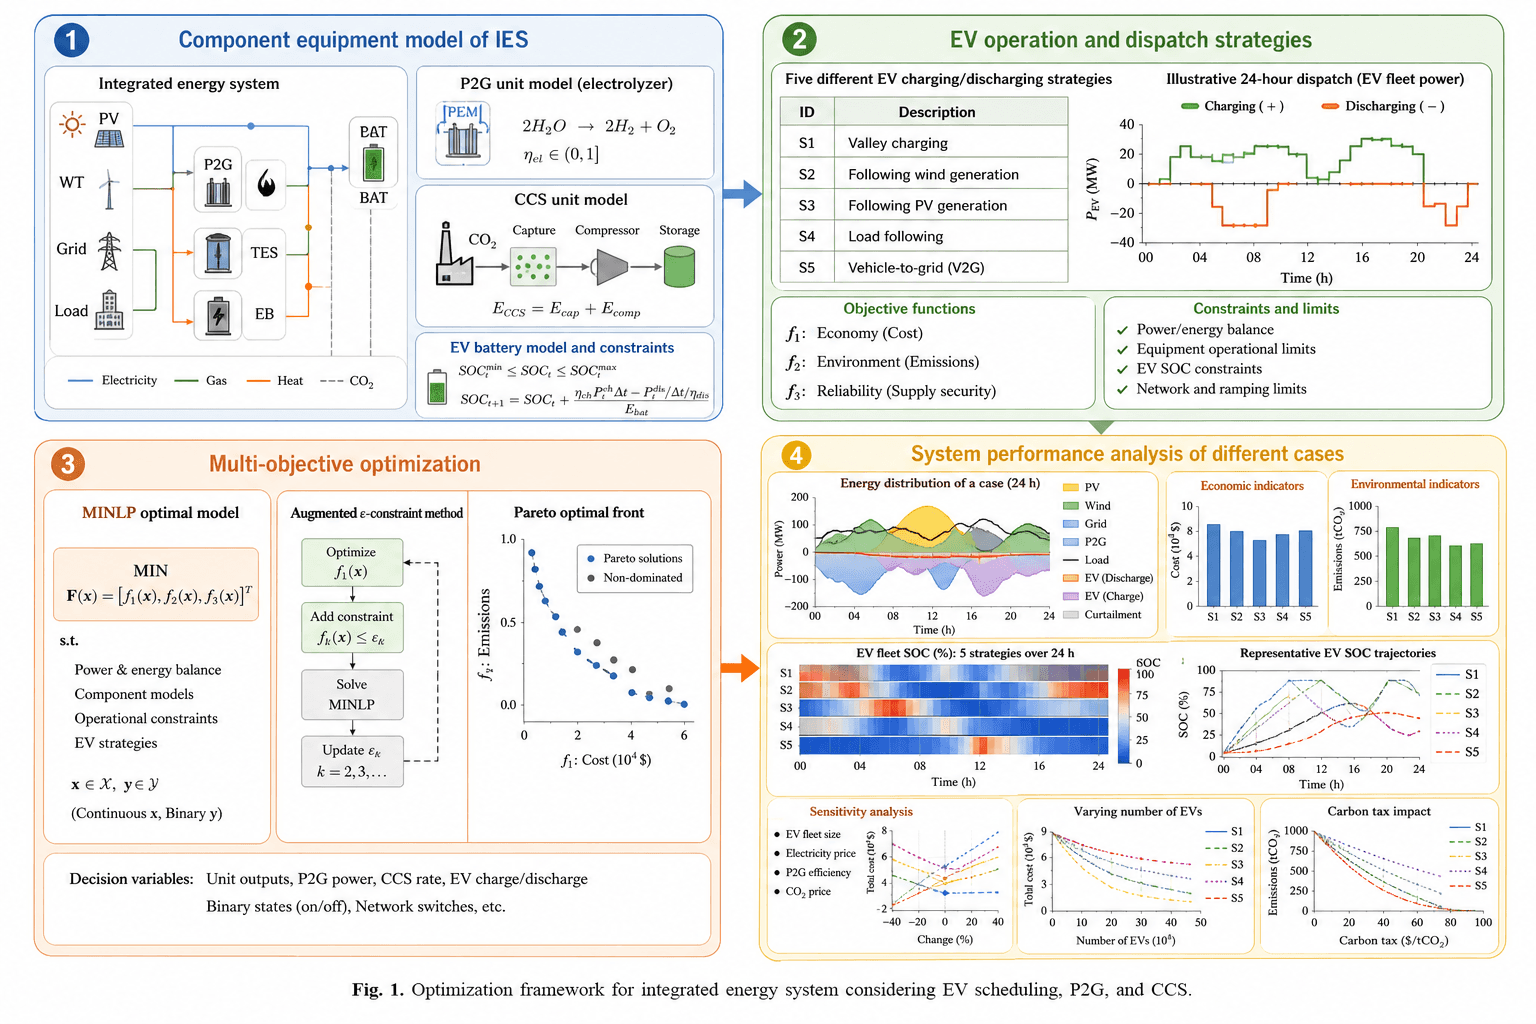
Four numbered, color-coded blocks set out modeling, strategies, solution method and results in a two-by-two grid, each split into equations, flow steps and small plots, built as the overall framework figure of an energy-systems paper or a thesis defense.
Prompt
Create a scientific figure about: Co-scheduling EVs and storage in an integrated energy system. Visual style: Clean Vector. Requirements: publication-ready scientific quality, clear labels and directional arrows where appropriate, avoid cartoon or stock-photo look, composition optimized for research papers and academic slides.
What this template is
The figure condenses an integrated-energy-system optimization study onto one page. Block one models the equipment: photovoltaics, wind, grid and load feeding power-to-gas, thermal storage, an electric boiler and a battery, with equations for electrolysis and carbon capture. Block two defines electric-vehicle charging and discharging strategies and three objectives, economy, environment and reliability. Block three states a mixed-integer nonlinear model solved by the augmented epsilon-constraint method into a Pareto front. Block four compares the strategies on cost, emissions and state of charge. A reader should be able to trace how equipment models feed objectives, how the solver trades them off, and where each result comes from.
Elements to label
System topology and flow legend
Equipment links in block one distinguished by line style for electricity, gas, heat and CO2, with the legend along the bottom.
P2G and carbon capture units
The electrolyzer with its water-splitting equation and efficiency range; capture, compression and storage stages with an energy balance.
EV battery constraints
State-of-charge bounds and the update equation in one box; place the charge and discharge efficiencies as your text does.
Strategy table
Block two lists S1 to S5: valley charging, following wind, following PV, load following and vehicle-to-grid.
Three objectives
f1, f2 and f3 for economy, environment and reliability, beside a checklist of constraints and limits.
Augmented epsilon-constraint loop
Optimize, add a constraint, solve and update epsilon stacked vertically, with a dashed return showing iteration.
Pareto front
Cost on the horizontal axis and emissions on the vertical, blue points joined into a front; legend names must match what the points are.
Result panels
Block four holds energy distribution, economic and environmental indicators, a state-of-charge heatmap, sensitivity and carbon-tax plots.
Where it is used
- Paper mechanism figure
- Defense slides
- Grant proposal
- Academic poster
What reviewers look for
The front legend is reversed
The sample labels the grey points non-dominated, yet they lie above the blue front and are in fact dominated; an energy-optimization reviewer will spot this at once, so rename them dominated or remove them.
Three objectives, two axes
The model has economy, environment and reliability objectives, but the front plots cost against emissions only; explain whether reliability became a constraint or a fixed level, or add a three-dimensional front or projections.
Battery model details
Reviewers check how efficiencies enter the state-of-charge update, the exclusivity constraint against simultaneous charging and discharging, and the time step; the sample formula has garbled characters, so restate it from your model.
Model class and solver
The figure says mixed-integer nonlinear; if you linearized the problem, call it mixed-integer linear instead, and name the solver and convergence criteria in the caption so the figure agrees with the text.
How to use it in Yila
- 1Pick a figure
- 2Describe your subject and the steps to stress
- 3Refine it in chat, then download the PNG
Tips
Do
- List the equipment and strategy labels your system really has in the prompt, so the topology and the table match your model.
- Ask for the result block to keep only the plots the paper discusses, and move the rest to supplementary material.
- Ask for each strategy in the table to keep one color in every result plot, so S1 to S5 can be followed across block four.
Avoid
- Do not keep the caption printed at the bottom of the image; captions belong to the manuscript, and editors will ask for its removal.
- Avoid reusing the curves and bar heights in the result panels; they are generated placeholders, not your simulation output.
Questions
Can this framework figure go straight into a paper?
It is a base for an overall framework figure. It is an AI-generated raster image with a wrong Pareto legend, garbled characters in some formulas and axis labels, and placeholder result plots, so replace and check each of these before submission.
Can elements in the figure be changed?
Not element by element, but you can keep refining it by chatting in Yila: drop the carbon-capture unit, cut the strategies to three, correct the front legend, remove the printed caption, or shrink the result block to two plots, then generate a new version.
What format is delivered?
An AI-generated PNG image in 4:3 landscape with very dense content. It is not a vector graphic, and formula subscripts and the ticks of the small result plots become nearly unreadable when reduced, so use it at full page width or split it into several figures.
Is it free?
Viewing this page and the sample costs nothing. Generating your own framework figure in Yila consumes credits, and new accounts receive 2,500 credits, enough to rework the four blocks against your own model one block at a time.
My system has storage but no EVs. Can it be adapted?
Yes. Ask for block two to describe storage charging and discharging strategies, keep the battery constraints, turn the strategy table into your operating modes and remove vehicle-to-grid from the labels; the Pareto front and the result block keep their structure.
Can the four blocks become separate figures?
Yes. Describe and generate each block on its own, for example only the equipment topology of block one or only the solution loop of block three. Separate figures carry larger text, suit a defense talk that covers one block per slide, and let a paper place the topology in the model section.