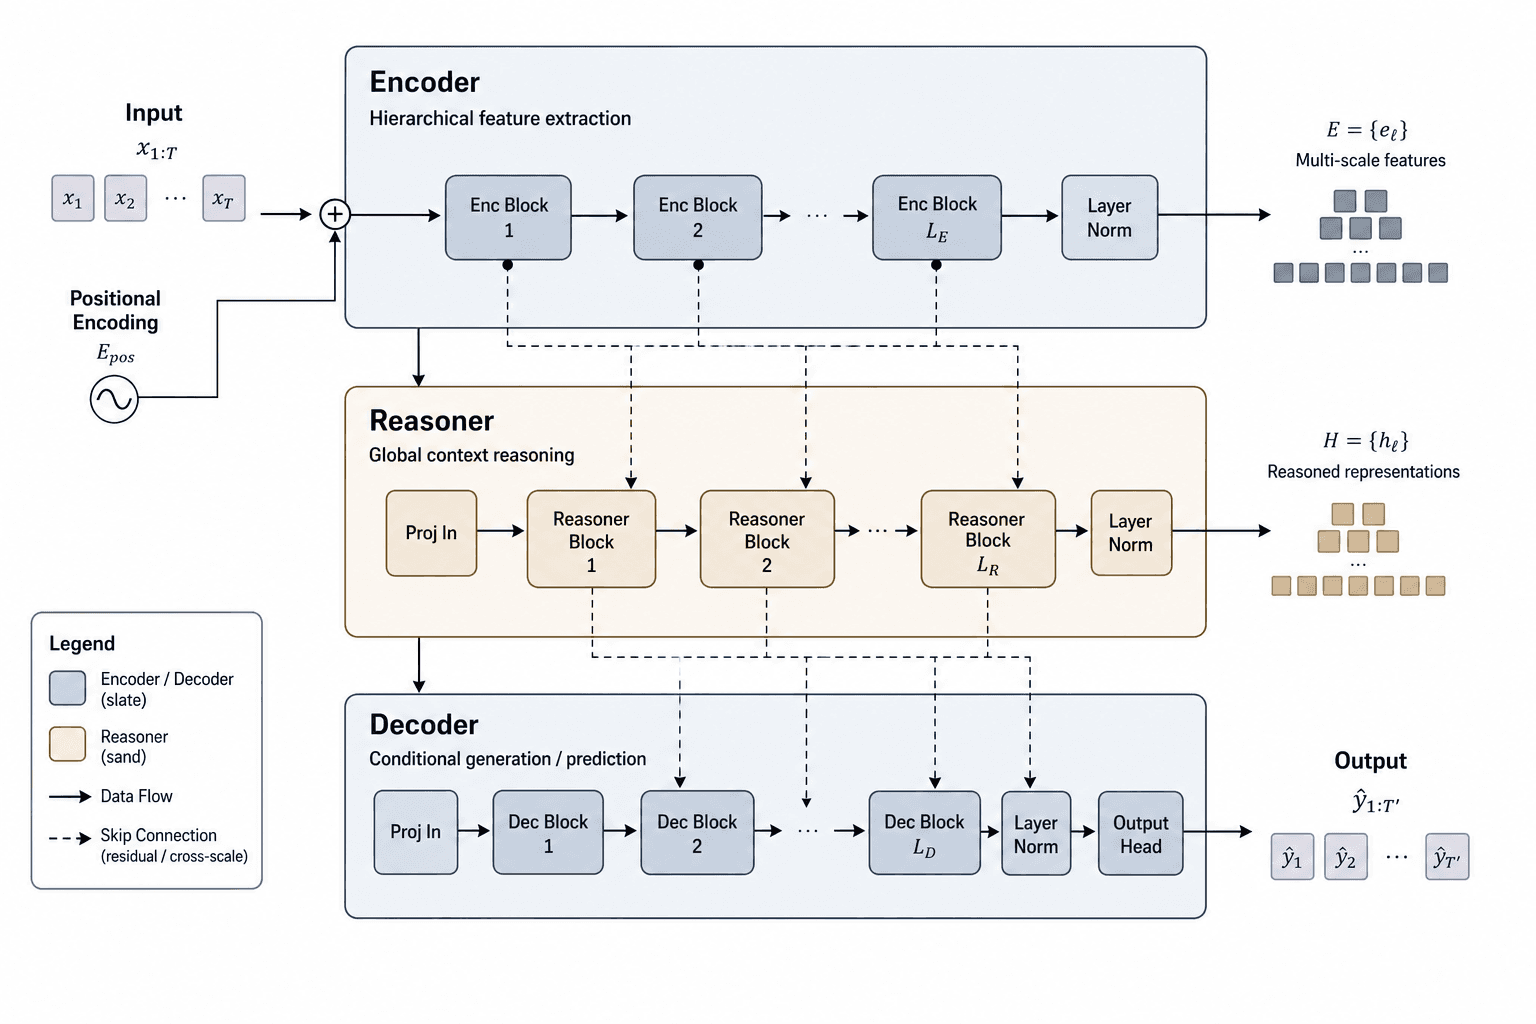
Figure template · System & Network · 4:3
Pareto Efficiency Figure for Quality–Cost Trade-offs
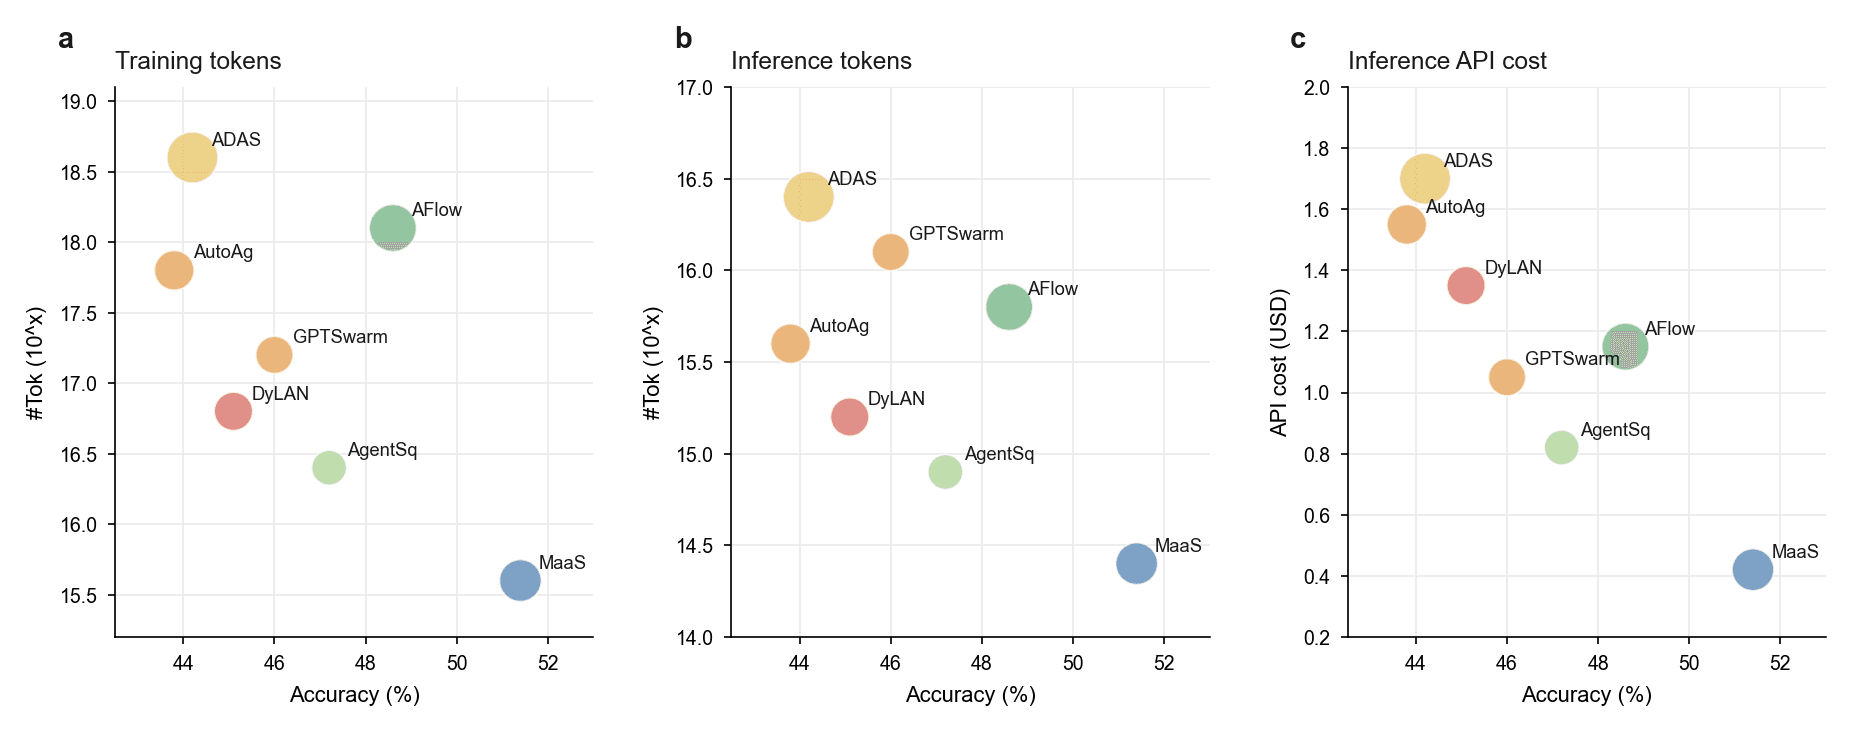
Three side-by-side panels share an accuracy axis while the vertical axis switches between training cost, inference cost and API spending, with one labelled bubble per method, built to argue that a new method wins on both quality and cost in a machine-learning paper.
Prompt
Create a scientific figure about: Pareto front and comparison bars for quality–cost trade-offs. Visual style: Clean Vector. Requirements: publication-ready scientific quality, clear labels and directional arrows where appropriate, avoid cartoon or stock-photo look, composition optimized for research papers and academic slides.
What this template is
The figure answers one question: does higher accuracy have to cost more? All three panels plot accuracy as a percentage along the bottom; the vertical axes show tokens spent in training, tokens spent at inference and the API bill at inference time. Further right means more accurate and lower means cheaper, so the bubble at the lower right sits in the best position under every cost. A reader should be able to tell which methods are beaten outright by another, and which ones form the frontier of the quality–cost trade-off, without reading the text first.
Elements to label
Panel letters and titles
Letters a, b and c at the upper left, with titles naming the cost directly, such as training tokens or inference cost.
Accuracy axis
Keep the same range in all three panels and the unit in percent, so one method can be compared across them.
Cost axes
If token counts are on a log scale, say so in words rather than with a bare power-of-ten placeholder.
Method bubbles
One fixed color per method with its name at the upper right of the bubble; colors must not change between panels.
Bubble size
Sizes vary in the sample with no legend; state whether size encodes parameter count, call count or something else.
Best trade-off point
If the blue bubble at the lower right is your method, give it a heavier outline or a star so it is seen first.
Pareto front line
The front named in the prompt is not drawn in the sample; join the non-dominated points with a line.
Where it is used
- Paper mechanism figure
- Defense slides
- Academic poster
- Graphical abstract
What reviewers look for
Draw the front
The figure is titled a Pareto front, yet the sample shows scattered points with no connecting line and no indication of which direction is better; reviewers will ask for the front and an arrow toward the lower right.
Same accuracy in every panel
Each method's accuracy must be identical across the panels, since it comes from one evaluation; if your x-values drift between panels, readers will suspect the evaluation setup changed between measurements.
One accounting for cost
Say whether token counts and API cost are per example or totals over the test set, and give the date of the prices used, otherwise the comparison between methods cannot be interpreted or repeated.
Show the variance
A single point stands for a single run; when accuracy gaps are small, reviewers will ask for error bars or confidence intervals over repeated runs to show the lower-right advantage is not noise.
How to use it in Yila
- 1Pick a figure
- 2Describe your subject and the steps to stress
- 3Refine it in chat, then download the PNG
Tips
Do
- Give the prompt each method's real accuracy and cost, or plot your own data and borrow only this layout.
- If you want the comparison bars the prompt mentions, ask in chat for a row of bars beneath the three scatter panels.
- Ask for an arrow labelled better pointing toward the lower right in each panel, so the reading direction is never in doubt.
Avoid
- Do not reuse the method names or positions in the sample; they were filled in during generation, not taken from any real evaluation.
- Avoid a unique color for every bubble with no legend, which forces readers to rely on tiny labels.
Questions
Can this efficiency figure go straight into a paper?
No. It is an AI-generated raster image whose coordinates and method names are placeholders, and a data figure has to come from your experiments. Use it as a layout model, redraw it from real numbers or regenerate it in Yila from your data, then check every point.
Can elements in the figure be changed?
Not element by element, but you can keep refining it by chatting in Yila: add the front line, cut it to two panels, give bubble size a legend, or add a row of comparison bars below, then generate a new version with those changes.
What format is delivered?
An AI-generated PNG image with three panels in a row, giving a very wide frame. It is not a vector graphic, and tick numbers and method labels shrink when the figure is fitted to one column, so confirm they stay readable at the target width, or ask for a stacked arrangement instead.
Is it free?
Browsing this page and the sample costs nothing. Generating your own version in Yila consumes credits, and new accounts receive 2,500 credits, enough to try a few panel counts and color schemes before choosing the version for your paper.
I want to compare latency rather than cost. Can it change?
Yes. Ask for the third panel's vertical axis to become inference latency, with its unit and the hardware it was measured on; the accuracy axis stays as it is, so the panels can still be read side by side.
Can the three panels be merged into one?
Ask for a single scatter plot with the cost you care about most on the vertical axis and a second cost encoded as bubble size. The result is more compact and suits a slide, but the legend must state clearly what each visual encoding stands for and in which units.