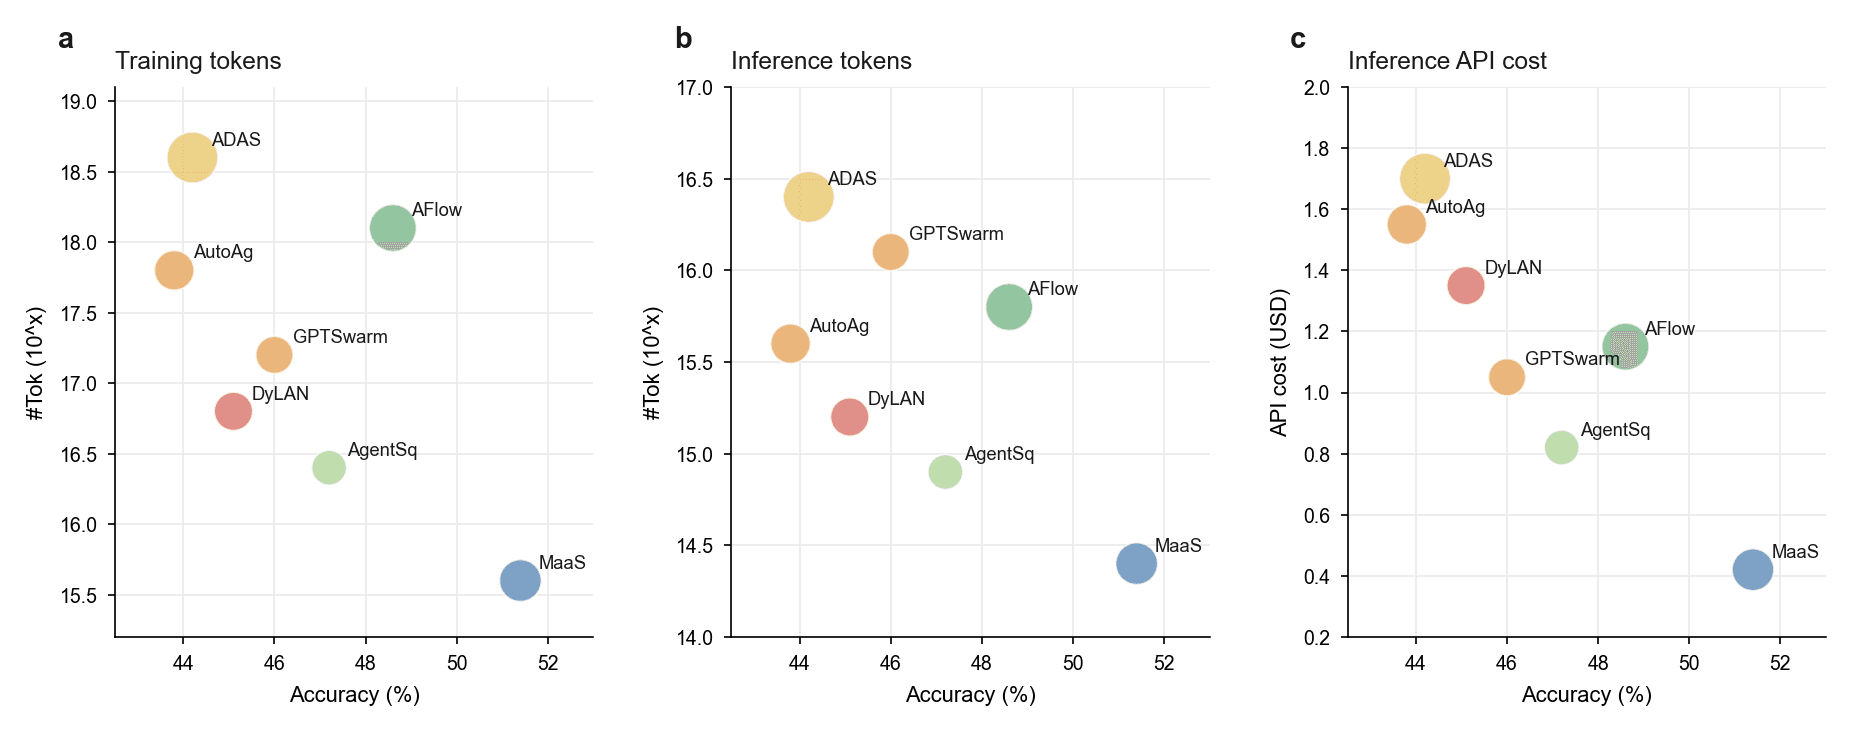
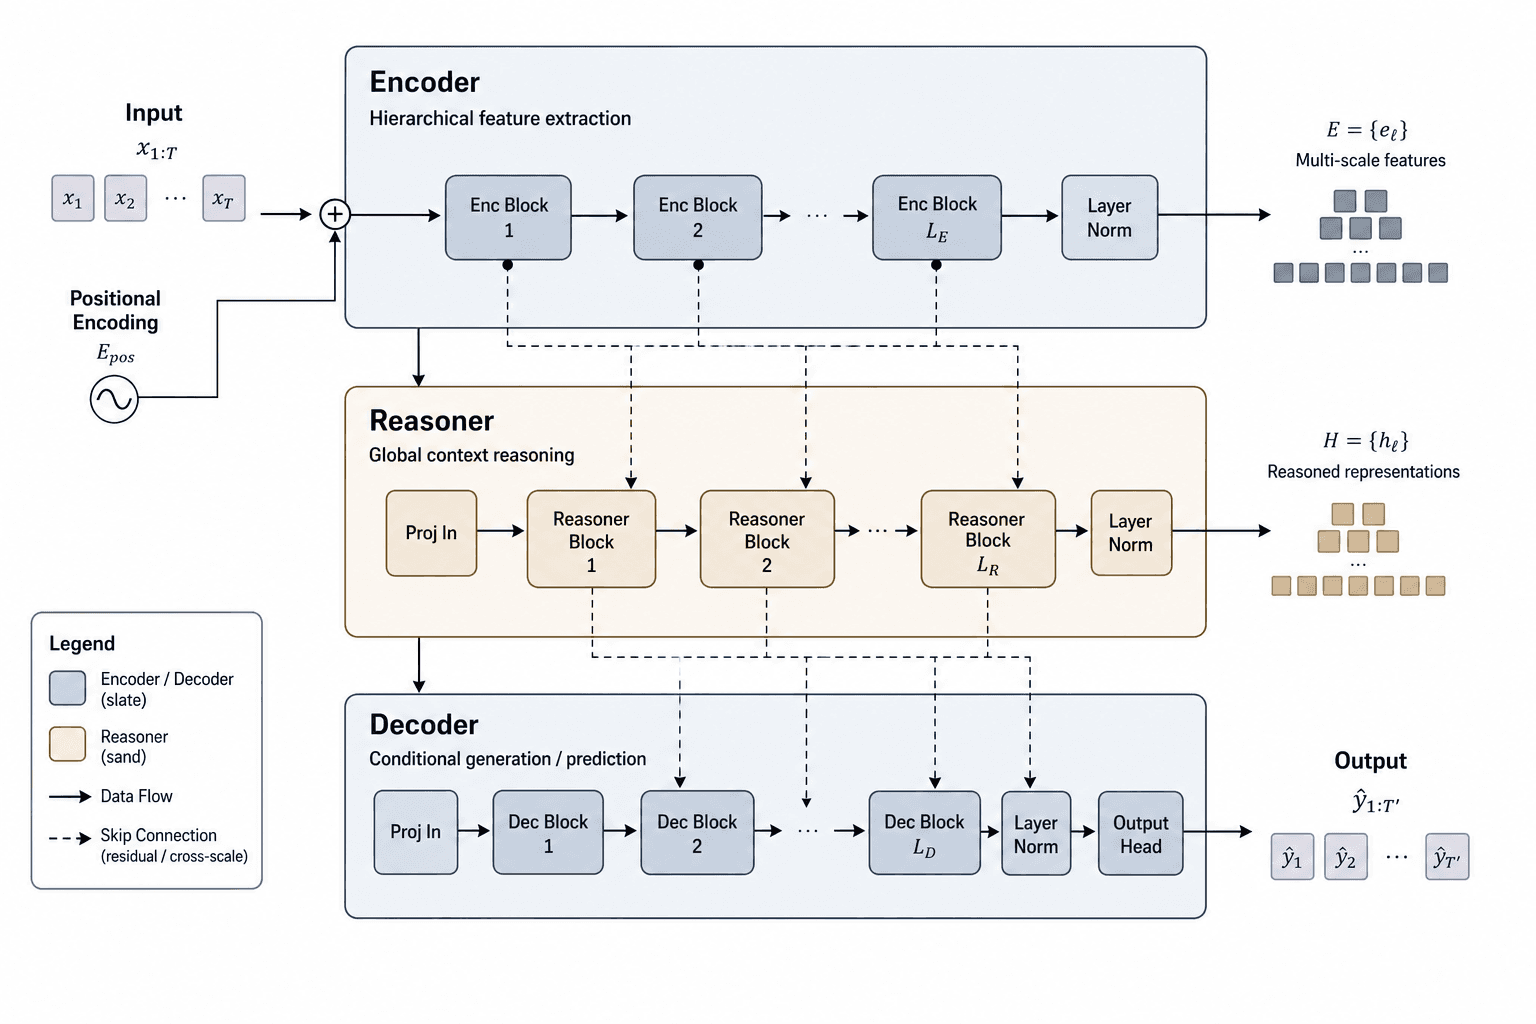
Figure template · System & Network · 4:3
Agentic Supernet with Query-Dependent Controller Routing
Three bands stack the story: tasks, controller, supernet and example agent loops on top; building blocks and query paths of rising complexity in the middle; and three performance-versus-cost curves at the bottom. Suited to multi-agent systems and LLM agent papers.
Prompt
Create a scientific figure about: Controller routing queries through an agentic supernet. Visual style: Clean Vector. Requirements: publication-ready scientific quality, clear labels and directional arrows where appropriate, avoid cartoon or stock-photo look, composition optimized for research papers and academic slides.
What this template is
The figure presents a supernet in which agent roles, such as planning, reasoning, acting, tool use, reflection and evaluation, are nodes, and a learned controller chooses the next node from the task, the current state and feedback. A factual question passes through a handful of nodes, while an open-ended synthesis visits many more. After reading it, a reviewer should understand why this differs from a single hand-built pipeline, and how depth, a cost penalty and repeated sampling trade accuracy against the price paid per query.
Elements to label
Benchmark task panel
Four rows at top left for logic, knowledge QA, coding and planning, each with example datasets to swap for yours.
Controller policy
A joystick icon captioned as the policy that selects the next agent from task, state and feedback.
Supernet node grid
Rows of coloured circles; keep one colour per role and repeat the six-role legend directly underneath.
Feedback loop
Dashed arrows from the supernet back to the controller, showing that each executed step informs the next routing decision.
Example agentic loops
Three framed loops at right: reason, act and observe; a multi-agent debate with a judge; and a draft, score and refine cycle.
Building blocks
A six-cell grid naming chain-of-thought, self-reflection, act-and-observe, debate, web search and an evaluator.
Paths by query complexity
Simple, medium and complex queries each drawn as a node chain, with a legend stating every node's step.
Performance and cost plots
Three dual-axis panels plotting performance and cost per query against layers, cost penalty and sampling count.
Where it is used
- Paper mechanism figure
- Defense slides
- Academic poster
- Course handout
What reviewers look for
Consistent role colours
Pink means Evaluate in the supernet legend but Answer in the query paths, and yellow stands for both Plan and Evaluate in the complex path. Reviewers will ask for one colour per role across every panel.
How the controller learns and stops
The figure says the policy picks the next agent from task, state and feedback, but not how it is trained, what reward it optimizes or when routing ends. Add those points to the caption or a short side note.
Origin of the plotted numbers
The three curves are placeholders, not results. When you substitute measurements, state the datasets, the number of runs, and whether the shaded bands show standard deviation or a confidence interval.
Mixed linear and log axes
Performance sits on a linear left axis and cost on a logarithmic right axis, which makes growth easy to misjudge. Name the scale and the pricing basis for cost in each axis title.
How to use it in Yila
- 1Pick a figure
- 2Describe your subject and the steps to stress
- 3Refine it in chat, then download the PNG
Tips
Do
- Replace the example datasets with the benchmarks you actually evaluate, keeping the four task groups as the entry point.
- Annotate the complex query path with the feedback signal the controller reads at each step, so the routing logic can be followed.
- Give each of the six node colours a single meaning and keep only one legend for them.
Avoid
- Pasting the sample curves into a paper; they are illustrative and carry no experimental evidence.
- Packing three loop examples and three plots into one submission figure when two figures would read more easily.
- Keeping the game joystick as the controller icon if your reviewers expect a formal depiction of the policy.
Questions
Can this supernet overview go straight into a paper as the method figure?
Use it as a draft for the method overview. It is an AI-generated illustration: the curves and example datasets are placeholders and the colour coding is not consistent between panels, so replace them with your own method details and results before submission.
Can I add agent types or change how routing works?
The image is not editable element by element and is not a vector graphic. Keep chatting in Yila, for example ask for a code-execution agent or a retrieval-based router in place of the policy, and the whole figure is regenerated around your description.
What format is delivered?
An AI-generated PNG image in a 4:3 landscape frame. It carries a lot of small text, so give it the full page width in a two-column paper; if you need vector art, redraw it in your diagramming tool following the three-band layout.
Is it free?
Viewing this page and the sample costs nothing. Generating the figure in Yila, and every revision after that, consumes credits. New accounts receive 2,500 credits, which covers a first version and several rounds of adjustments to node roles and paths.
Can I keep only the top band as a graphical abstract?
Yes. Ask Yila to draw just the tasks, the controller, the supernet and the feedback loop, leaving out the building blocks, the example loops and the plots. The result is far less crowded and works well as a graphical abstract, an opening slide in a talk or a figure on a lab website.
Can the plots show my experimental data?
Generated curves only approximate a trend you describe, and their values cannot be trusted. Plot your real measurements in your usual charting tool, with the same performance and cost axes, and then combine that panel with the architecture part of this figure for the final layout.