Figure template · System & Network · 4:3
Clinical Data Lakehouse with ETL and Feature Store
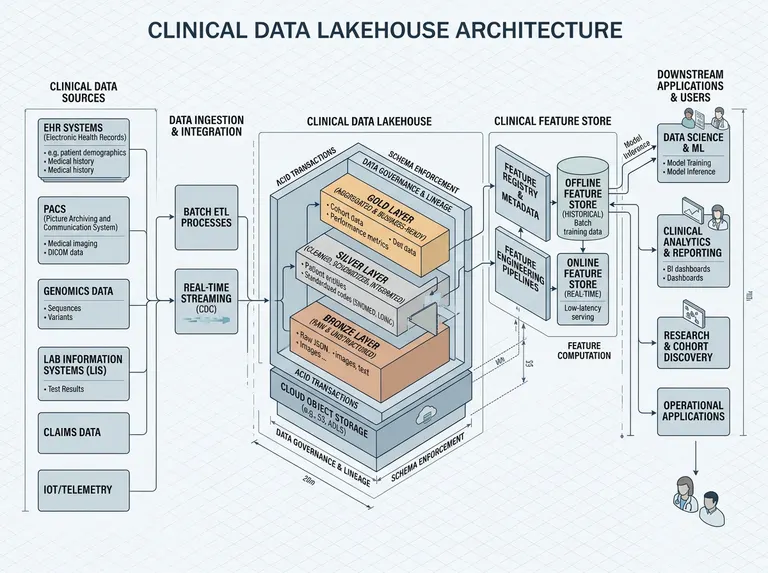
A landscape architecture diagram in five columns that carries multi-source clinical data through batch and streaming ingestion into a layered lakehouse and out through a feature store to machine learning, analytics and cohort research, for medical informatics papers and data platform grants.
Prompt
Create a scientific figure about: Clinical data lakehouse architecture with ETL and a feature store. Visual style: Clean Vector. Requirements: publication-ready scientific quality, clear labels and directional arrows where appropriate, avoid cartoon or stock-photo look, composition optimized for research papers and academic slides.
What this template is
The left column stacks the sources: electronic health records, the picture archiving system, genomics, the laboratory information system, claims and IoT telemetry. Batch ETL and change-data-capture streaming feed a lakehouse in three tiers: bronze keeps raw and unstructured data, silver cleans it and maps standard codes such as SNOMED and LOINC, and gold holds aggregated cohort and performance data, all on object storage framed by ACID transactions, schema enforcement, governance and lineage. A feature store with a registry, engineering pipelines and offline and online stores then serves training, inference, reporting and cohort discovery. A reader should be able to follow every hop from capture to model.
Elements to label
Clinical data sources
Six source boxes stacked on the left; the sample's EHR box lists medical history twice, so delete the repeat.
Batch ETL and streaming
Two parallel entry points, the streaming one captioned as change data capture, both arrows landing on the bronze tier.
Bronze layer
Labelled raw and unstructured, with example contents such as JSON records, images and free text.
Silver layer
State cleaning, patient entity resolution and code mapping; the small text on this tier is misspelled in the sample.
Gold layer
Labelled as analysis-ready aggregates, for example cohort tables and quality or performance metrics.
Governance frame
ACID transactions, schema enforcement, governance and lineage written on the lakehouse frame, with object storage underneath.
Feature store
Registry, engineering pipelines, offline store for batch training and online store for low-latency serving, as four distinct blocks.
Downstream users
Data science and ML, clinical analytics and reporting, research and cohort discovery, and operational applications.
Where it is used
- Paper mechanism figure
- Grant proposal
- Defense slides
- Lab website
What reviewers look for
Privacy and de-identification
The diagram has no de-identification, access control or audit step. Informatics reviewers will ask at which tier protected health information is removed and who may read the gold layer.
Point-in-time correct features
Training features drawn from the offline store must be taken as of each prediction time, or lab results recorded after diagnosis leak into the model. Say in the legend whether features are reconstructed point in time.
Codes and common data model
The silver tier names only SNOMED and LOINC. Expect questions about medication and diagnosis vocabularies and whether you map to a common data model such as OMOP, and complete the labels to match your pipeline.
Does streaming earn its place
The streaming path runs from capture to the online store. If you claim bedside alerting, report the latency that supports it; for purely retrospective research, remove the streaming lane altogether.
How to use it in Yila
- 1Pick a figure
- 2Describe your subject and the steps to stress
- 3Refine it in chat, then download the PNG
Tips
Do
- List the sources your platform really ingests, say EHR and imaging only, so Yila drops the boxes you do not have.
- If ethics review applies, ask for a de-identification step before the silver tier and a marked access boundary around gold.
- Name your downstream products, such as a sepsis model or a registry dashboard, so the right-hand column describes real deliverables.
Avoid
- Do not keep the stray dimension marks and vertical scribbles around the lakehouse block; check that the frame is clean.
- Do not name a specific cloud vendor's storage product in the storage box; a generic object storage label is enough.
Questions
Can this architecture diagram go straight into a paper?
Use it as a first draft of your system figure. It is an AI-generated image whose silver and gold labels contain misspellings and whose lakehouse block is surrounded by meaningless dimension marks, so check every label and keep refining it in chat until it meets the journal's requirements.
Can I replace the blocks with our hospital's components?
Not element by element, but you can keep refining it by chatting in Yila. Describe your sources, ingestion and downstream uses, for instance removing claims and adding follow-up questionnaires, and it will rearrange the five columns and generate a new version.
Which format do I get?
An AI-generated PNG image in a 4:3 landscape frame, suitable for papers, grant documents and presentation slides. It is not a vector graphic, and the small captions inside each tier soften when enlarged, so check legibility at the size you need.
Is it free?
Browsing this page and the sample costs nothing. Generating and editing in Yila consumes credits, and a new account receives 2,500 credits, enough to rework the sources and downstream applications for your own platform over several versions.
Can it show a multi-site federated version?
Describe it in the conversation, for example one lakehouse per hospital with only model parameters sent to a central coordinator, and it will split the single lakehouse into several sites and mark the direction in which parameters travel. Patient-level data then stays visibly inside each site's boundary, which is the point reviewers look for.
Does it suit a data infrastructure grant?
Yes. Five columns from capture to use explain what the platform will build at a glance. For a proposal, ask it to tag each column with the work package it belongs to, so the figure lines up with your technical plan and reviewers can find each deliverable in the diagram.