Figure template · Graphical Abstract · 4:3
Immunology Graphical Abstract with a CAR-T Therapy Example
A six-step graphical abstract that tells an immune response as one line from blood draw to clinical outcome through CD19 CAR-T therapy, with panels for T cell activation, cytokine release, target killing and tumour regression, for cell therapy papers and grant proposals.
Prompt
Create a scientific figure about: Immunology graphical abstract covering antigen exposure, innate activation, T-cell priming, and therapeutic outcome. Visual style: Clean Vector. Requirements: publication-ready scientific quality, clear labels and directional arrows where appropriate, avoid cartoon or stock-photo look, composition optimized for research papers and academic slides.
What this template is
The numbered panels follow one CD19 CAR-T course. T cells isolated by leukapheresis receive, through a lentiviral vector, a chimeric receptor built from an anti-CD19 scFv, a hinge and transmembrane region, a costimulatory domain and a CD3ζ signalling domain, and are expanded ex vivo. The patient is lymphodepleted, the cells are infused, and they recognize CD19 on lymphoma cells, activate, release cytokines and kill their targets. The final panel shows tumour regression and survival. A reader should be able to trace antigen recognition all the way to outcome and say which panel each therapeutic step belongs to.
Elements to label
Antigen recognition
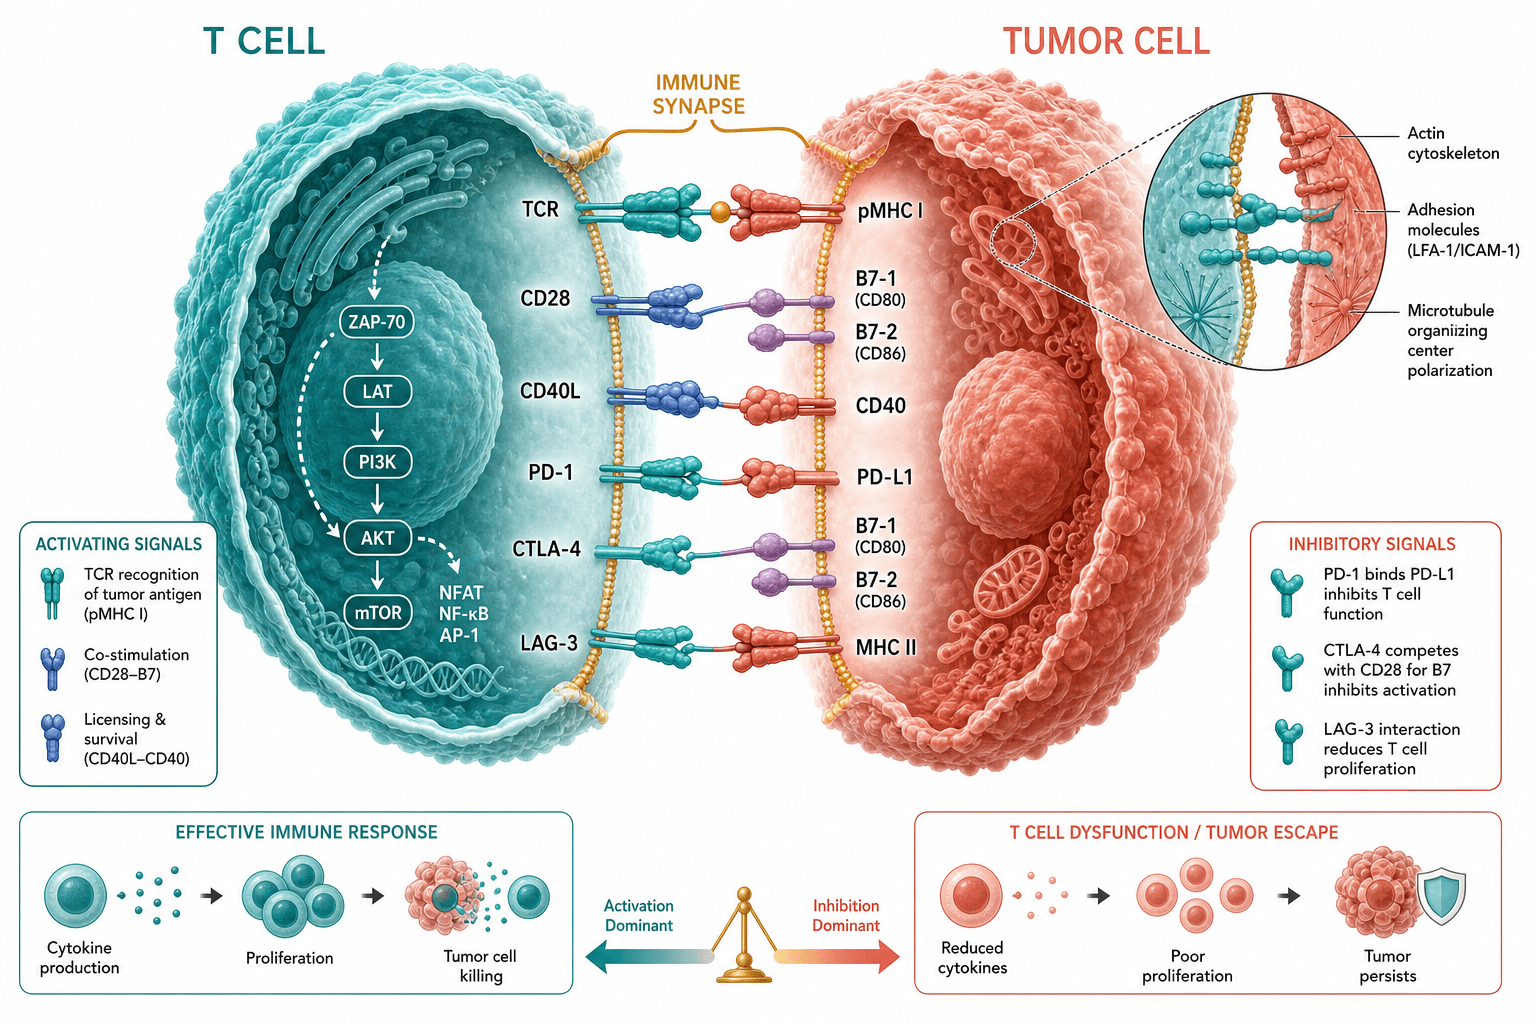
Draw CD19 on the tumour cell docking with the scFv end of the CAR, and label it as direct recognition that needs no MHC presentation.
T cell activation
Write CD3ζ and the costimulatory domain on the activation label, showing that the CAR supplies both signals at once at the tumour contact.
Cytokine signalling
List IFN-γ, TNF-α and IL-2 beside the released particles, and keep them on their own arrow, separate from the killing arrow.
Effector response
Show perforin- and granzyme-driven killing as fragmenting target cells, with the arrow running from the CAR-T cell to the lymphoma cells it contacts.
Therapeutic outcome
Put the before-and-after tumour and the survival curve in the last panel, replacing the curve with your own data or clearly marking it as schematic.
Where it is used
- Graphical abstract
- Grant proposal
- Defense slides
- Academic poster
What reviewers look for
The survival curve is not data
The last panel's survival curve carries a significance label and looks like a result, but it is an AI-drawn sketch. Replace it with your own data, or remove the statistic and call it schematic in the legend so no reader cites it.
The innate arm is missing
Innate activation, part of this template's brief, does not appear in the sample, which begins at T cell isolation. If your work involves antigen-presenting cells or adjuvants, add that stage so antigen exposure connects to T cell priming.
Conditioning comes before infusion
Lymphodepletion must finish before the cells go back in, and the text between those panels in the sample runs in vivo expansion and cyclophosphamide together. Rewrite it so readers know which step the drugs belong to.
Not the endogenous TCR
CAR-T cells recognize surface antigen through the chimeric receptor without MHC presentation, so the activation label should name the CAR signalling domains rather than showing a T cell receptor engaging MHC, which would blur the mechanism.
How to use it in Yila
- 1Pick a figure
- 2Describe your subject and the steps to stress
- 3Refine it in chat, then download the PNG
Tips
Do
- Put your target antigen and tumour type in the prompt so the killing and outcome panels follow your study rather than CD19 lymphoma.
- If you need a ring-shaped abstract, ask for a circular layout explicitly; the sample is a six-step path that doubles back.
- Keep cytokine release and target killing on two separate arrows, which leaves room to annotate safety readouts such as cytokine levels later.
Avoid
- Do not leave the sample survival curve or its statistic in a final figure; it is not the result of any study.
- Do not keep the garbled sentence about in vivo expansion in the middle; read every panel's text after each generation.
- Do not let the before-and-after tumour drawings imply a response rate; describe the response your trial measured in the legend instead.
Questions
Can it go straight into a paper as the graphical abstract?
Use it as a sketch. It is an AI-generated PNG, the sample survival curve is invented, and one sentence in the middle is spliced together, so check every panel and keep refining it in chat until it meets the journal's abstract size and colour rules.
Can I change elements in the figure?
Not element by element, but you can keep refining it by chatting in Yila: swap CD19 for your target antigen, change lymphoma to a solid tumour, add an innate activation stage or remove the survival curve, then generate a new version.
What format is delivered?
An AI-generated PNG image; the sample is square, which suits graphical abstracts, posters and slides. It is not a vector graphic, so if the journal wants a larger file or a wide banner, check that the smaller labels stay legible when enlarged or reflowed.
Is it free?
Opening this page and viewing the sample cost nothing. Generating in Yila consumes credits, and new accounts receive 2,500 credits, enough to rework this abstract around your own target antigen, tumour model and endpoints several times before you choose a final version.
I study vaccine-induced immunity, not cell therapy. Can I use it?
Yes, with larger changes. Describe the antigen source, innate cell activation and T cell priming in the lymph node in the prompt, ask it to drop the apheresis, transduction and infusion panels, and make the endpoint the antibody or T cell response you measured.
Can it show safety, such as cytokine release syndrome?
Ask in the conversation for a safety branch beside the cytokine panel that names the adverse events you observed and how they were managed. Keep to what your paper reports, so the figure does not add readouts you never measured.