Figure template · Graphical Abstract · 4:3
Treatment Reshaping the Immune Cell Landscape
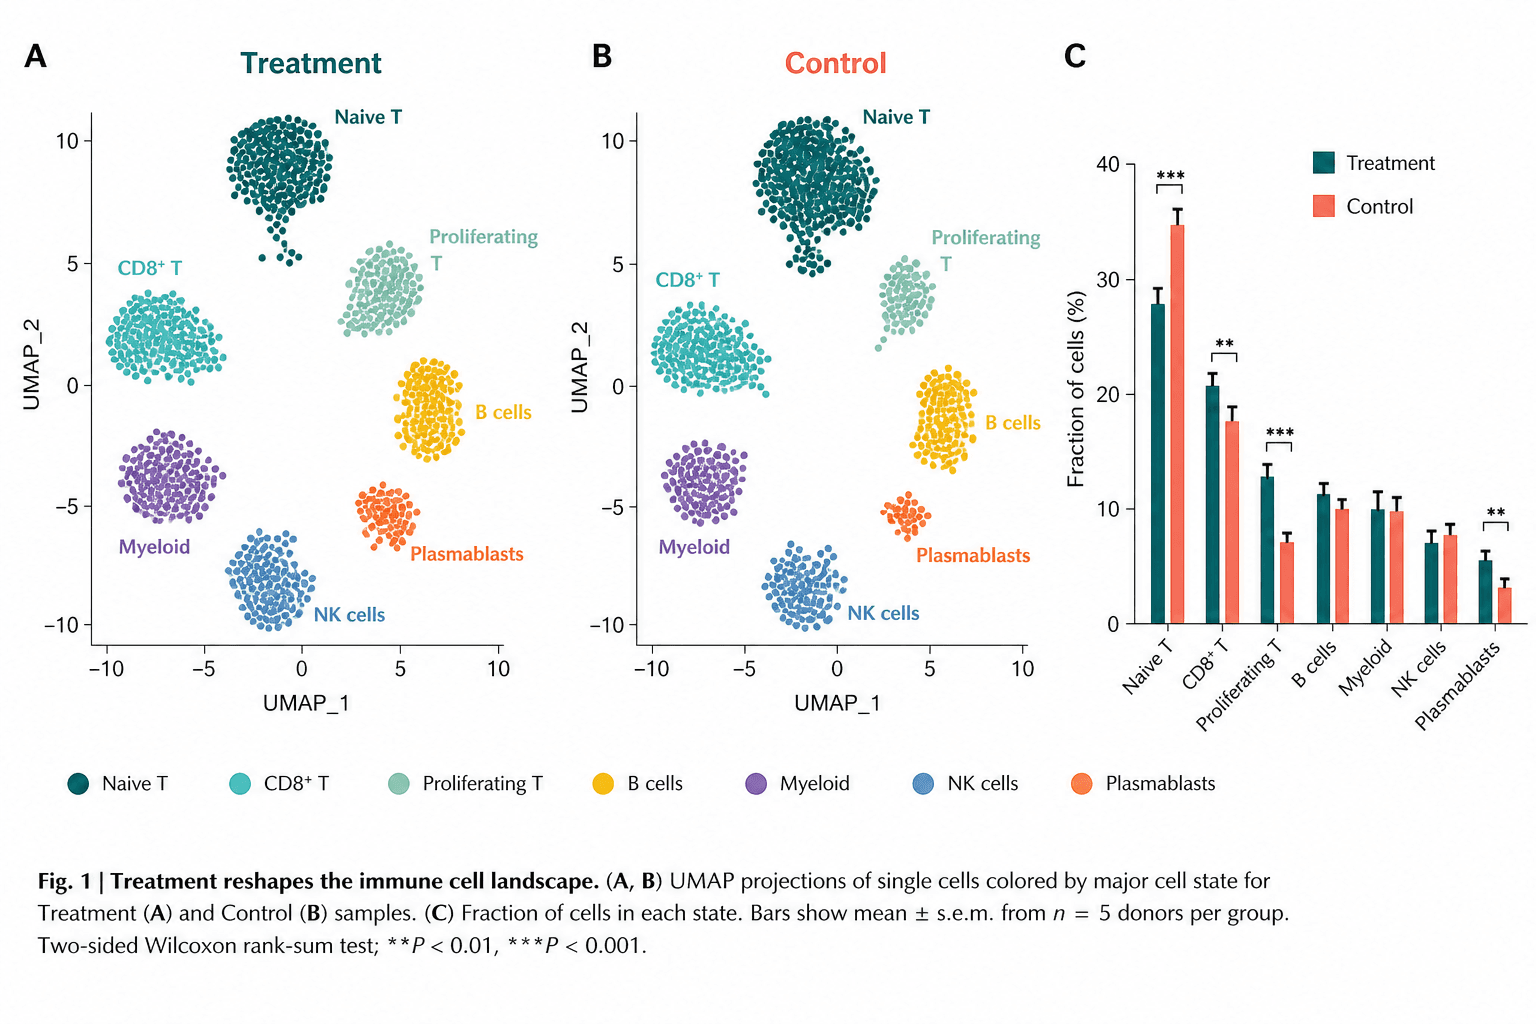
Two UMAP panels place treated and control single cells side by side, coloured by immune cell state, while a grouped bar chart turns cluster sizes into fractions that can be compared and tested directly.
Prompt
Create a scientific figure about: Graphical abstract in which treatment reshapes the immune cell landscape. Visual style: Clean Vector. Requirements: publication-ready scientific quality, clear labels and directional arrows where appropriate, avoid cartoon or stock-photo look, composition optimized for research papers and academic slides.
What this template is
The figure answers one question: what did treatment change in the composition of immune cells? The two UMAPs share axes and cluster positions, so a reader first sees that the same states, from naive and CD8+ T cells to myeloid cells and plasmablasts, exist in both groups. The bar chart on the right then does what scatter plots cannot, comparing the fraction of each state between groups with error bars and significance brackets. After reading it, someone should be able to say which populations expanded, which contracted, and which stayed essentially the same under treatment.
Elements to label
Treatment UMAP
Panel A, titled Treatment, keeps UMAP_1 and UMAP_2 axes with exactly the same ranges as the control panel.
Control UMAP
Panel B, titled Control in a contrasting colour, with clusters in the same positions so each can be matched by eye.
Cell state labels
Write each state's name beside its cluster, such as Naive T or Plasmablasts, in the cluster's own colour.
Shared legend
One row of coloured dots under the UMAPs lists every state; the colours must stay identical across all three panels.
Grouped bar chart
Panel C plots fraction of cells in percent, one pair of treatment and control bars for each cell state.
Error bars and brackets
Standard error on each bar, with a bracket and stars over the pairs that differ, defined in the caption.
Caption block
A bold one-line finding, then panel contents, what the bars show, the sampling unit and the statistical test.
Where it is used
- Graphical abstract
- Defense slides
- Academic poster
- Grant proposal
What reviewers look for
Can the test reach those stars
The caption names a two-sided rank-sum test, yet with the donor count it states per group that test cannot produce the smallest P value marked. The triple stars are impossible as written and must be replaced with your real result.
UMAP and bars must agree
The bars show a clear difference in naive T cells, but that cluster looks the same size in both UMAPs. Reviewers compare the two, so downsample each group to its real cell count before plotting.
What the fraction is of
A fraction computed per donor and averaged differs from one computed on pooled cells, and the error bars and test change with it. State in the caption that the unit is the donor, not the cell.
Is reshaping too strong a word
Several of the seven states barely move between groups, so a title claiming the whole landscape was reshaped may read as overstated. A narrower claim, such as expanded proliferating and CD8+ T cells, is easier to defend.
How to use it in Yila
- 1Pick a figure
- 2Describe your subject and the steps to stress
- 3Refine it in chat, then download the PNG
Tips
Do
- Put control on the left and treatment on the right, matching the baseline-then-intervention order most readers expect.
- Ask Yila to rewrite the caption with your actual test and sampling unit, and adjust the stars to match.
- With more than seven states, label only the major clusters on the UMAP and let the legend carry the rest.
Avoid
- Do not reuse the sample caption's donor count or test name; they are generated placeholder text.
- Do not let long labels like Proliferating T break over two lines beside a cluster, where they read as two populations.
Questions
Can it go straight into a paper?
It works as a starting point for layout and colour, not as a substitute for data. The scatter points, bar heights, stars and caption are all AI-generated illustration, so rebuild the panels from your own single-cell results and check that your statistical test can actually support the significance you mark before submitting.
Can elements in the figure be changed?
Not element by element, but you can keep refining it by chatting in Yila: rename or add cell states, swap the two groups left to right, turn the bar chart into box plots, or drop the caption and keep only the panels, then generate a new version from that description.
What format is delivered?
An AI-generated PNG image in a 4:3 landscape layout. It is not a vector graphic, so the small cluster labels and the significance stars soften when the figure is reduced. Check it at the size it will occupy on the page before using it as a main figure.
Is it free?
Viewing this page and the sample costs nothing. Generating or revising your own version in Yila consumes credits, and a new account receives 2,500 credits, enough to try several panel orders, state names and caption wordings to see which arrangement reads most clearly.
I have several time points, not just two groups. Can it be adapted?
Yes. Give Yila your groups in order and ask for a row of UMAPs on shared axes, with the bar chart showing one bar per time point inside each cell state, all in one consistent palette, and the caption rewritten to describe the new design and its comparisons.
Can I keep just the bar chart?
Ask for the fraction chart and its legend alone, with the cell state names written horizontally below the axis. On its own it suits a defense slide well, and it lets you talk through the few populations that change most without the UMAPs competing for attention.