Figure template · Graphical Abstract · 4:3
Patient-Derived Organoid Drug Screening Graphical Abstract
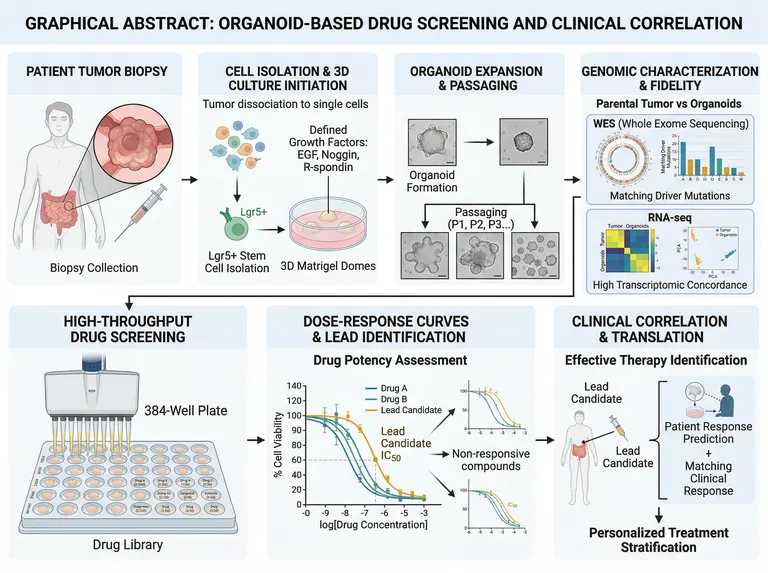
A landscape graphical abstract of seven panels, four above and three below, running from a patient's tumour biopsy through 3D culture, passaging and genomic fidelity to high-throughput screening, dose-response curves and clinical correlation, for organoid and precision oncology papers.
Prompt
Create a scientific figure about: Organoid drug-screening graphical abstract from biopsy and 3D culture through screening and personalized therapy. Visual style: Clean Vector. Requirements: publication-ready scientific quality, clear labels and directional arrows where appropriate, avoid cartoon or stock-photo look, composition optimized for research papers and academic slides.
What this template is
A colorectal tumour biopsy is dissociated to single cells and grown in 3D matrix domes with EGF, Noggin and R-spondin, and the organoids are expanded over successive passages. Whole exome sequencing and RNA-seq compare them with the parental tumour to show that driver mutations and expression profiles are preserved. A drug library is then screened across multiwell plates, dose-response curves and IC50 values pick a lead candidate, and the organoid result is checked against the patient's actual response to stratify treatment. A reader should understand how the organoid stands in for the patient.
Elements to label
Patient biopsy
A body outline marking the intestinal tumour, a magnified circle of the mass, and a caption for biopsy collection.
Dissociation and 3D culture
Single cells moving into matrix domes, with EGF, Noggin and R-spondin named as the defined growth factors.
Organoid passaging
Brightfield thumbnails from formation to expansion, passages marked P1, P2 and P3, with scale bars kept.
Exome fidelity
A circular plot and bar chart comparing the driver mutations shared by parental tumour and organoids.
Transcriptomic concordance
A heatmap and principal component plot comparing tumour and organoid expression, titled to say what is being compared.
High-throughput screen
A multichannel dispensing head over a plate whose wells name drug and concentration, with the drug library labelled below.
Dose-response curves
Percent viability against log concentration, with the IC50 of the lead candidate marked on its curve.
Clinical correlation
The lead candidate returned to the patient, predicted versus observed response, and an arrow to personalized stratification.
Where it is used
- Graphical abstract
- Paper mechanism figure
- Grant proposal
- Academic poster
What reviewers look for
The IC50 is read at the wrong height
The dashed IC50 line meets the curve at roughly sixty percent viability, whereas IC50 marks half-maximal inhibition, and the viability axis climbs far above full scale. Reviewers will ask for the curves to be redrawn on normalized data.
The lead curve is the weakest
The orange curve labelled lead candidate sits furthest right, the least potent of the three. That contradicts the label; give it to the most potent or most selective compound in your actual screen.
Fidelity evidence contradicts itself
The principal component plot separates tumours from organoids into two clusters while the caption claims high transcriptomic concordance. Show how matched pairs actually cluster in your data and state which passage was compared.
Plate format and controls
The plate's stated format does not match the number of wells drawn, and no negative or positive control wells are visible. A screening schematic should at least show vehicle controls, a positive control and replicates.
How to use it in Yila
- 1Pick a figure
- 2Describe your subject and the steps to stress
- 3Refine it in chat, then download the PNG
Tips
Do
- Name the tumour type and tissue of origin, such as pancreatic or breast cancer, so the body outline and growth factors fit your model.
- Give the prompt your lead compound and the potency ranking from your screen so the curve order matches the results section.
- Ask for vehicle and positive control wells to be coloured distinctly on the plate so the screening design reads at a glance.
Avoid
- Do not keep the garbled drug names on the plate; check each well label, or ask for colour-coded groups instead.
- Do not leave a commercial matrix brand name on the culture panel; a generic term such as basement membrane extract is enough.
Questions
Can I submit this graphical abstract as it stands?
Use it as a draft. It is an AI-generated image whose IC50 marker, lead-candidate curve and principal component plot all disagree with their own captions, and whose plate carries garbled drug names. Check every panel and keep refining it in chat before it goes to a journal.
Can the dose-response panel show my own data?
Not element by element, and it will not plot raw values precisely, but you can refine it by chatting in Yila: give the drug names and potency order and it will redraw the schematic curves and labels. For exact curves, plot your statistics separately and keep this panel illustrative.
What format does it come in?
An AI-generated PNG image in a 4:3 landscape frame, usable as a graphical abstract or slide illustration. It is not a vector graphic, and the plate labels and axis ticks are small, so check legibility before enlarging it for a poster, or ask for fewer, larger labels.
Is it free to generate?
Viewing this page and the sample costs nothing. Generating and editing in Yila consumes credits, and a new account receives 2,500 credits, enough to adapt the tumour type, drugs and readouts to your own study over several rounds until the panels match your data.
Can it show toxicity screening on normal-tissue organoids?
Yes. Explain in the conversation that the organoids come from normal tissue and the readout is toxicity rather than efficacy, and it will turn the clinical correlation panel into a safety assessment and relabel what the dose-response curves mean, so the abstract no longer implies a therapeutic claim.
Can immune cell co-culture be added?
Describe the co-cultured cells, for example autologous T cells, and it will add immune cells to the 3D culture panel and an immunotherapy arm to the screening panel, so the abstract covers both tumour-intrinsic and immune-mediated responses.