Figure template · Lab Apparatus · 4:3
Organoid Trapping in a Serpentine Microfluidic Chip
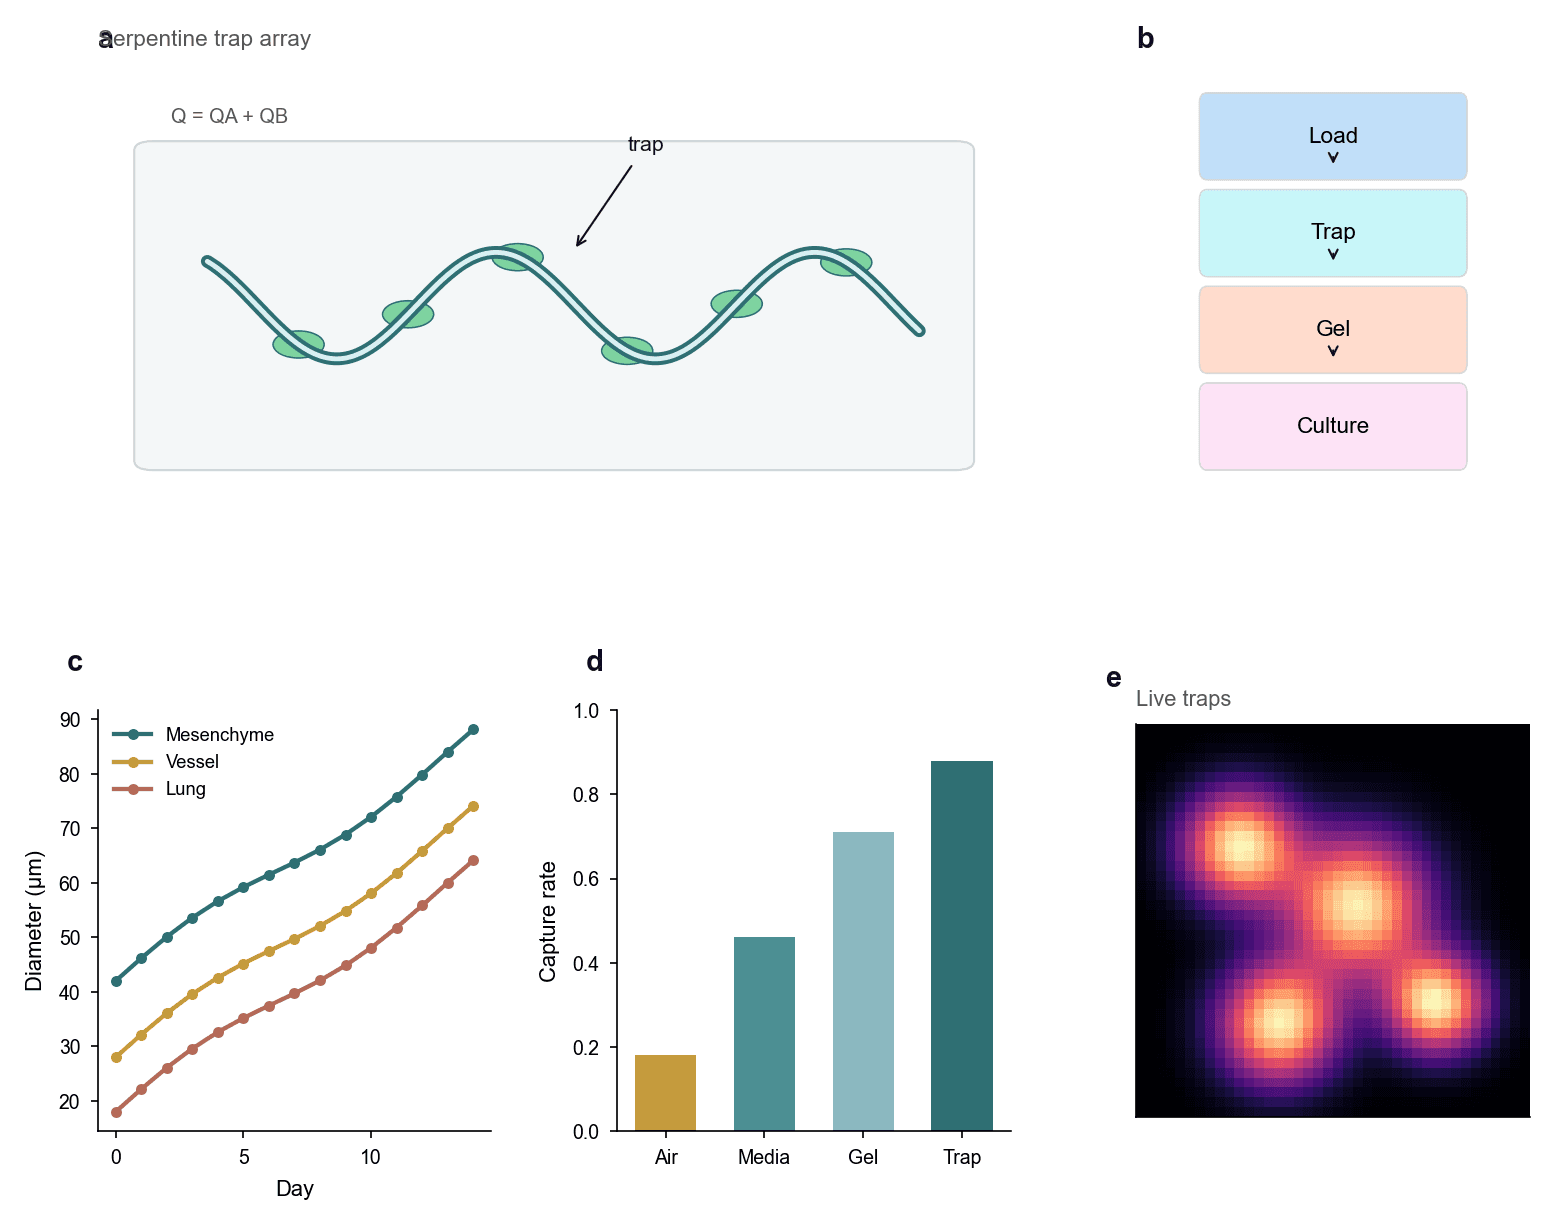
A serpentine channel holds organoids along its bends, a four-step workflow runs from loading through to culture, and growth curves, capture rates across four conditions and a live fluorescence view show what happens after trapping.
Prompt
Create a scientific figure about: Organoid trapping in a serpentine microfluidic chip. Visual style: Clean Vector. Requirements: publication-ready scientific quality, clear labels and directional arrows where appropriate, avoid cartoon or stock-photo look, composition optimized for research papers and academic slides.
What this template is
The page makes one argument: organoids can be held at fixed positions in a flowing channel, and they keep growing once they are. The serpentine array shows where they come to rest and states that total flow is the sum of two streams. The workflow block gives the order of operations. Growth curves then track diameter over days for three tissue origins, a bar chart compares how many organoids are captured under four loading conditions, and the fluorescence view shows which trap positions still hold living tissue. A reader should be able to say which loading condition works best.
Elements to label
Serpentine trap array
Panel a draws one sinusoidal double-line channel with green organoids resting along the inside of the bends.
Trap annotation
A single angled arrow marks one organoid as a trap, leaving the other positions unlabelled to avoid clutter there.
Total flow expression
A short line above the channel states that total flow is the sum of the two inlet streams, defined in the caption.
Four-step workflow
Panel b stacks load, trap, gel and culture as coloured blocks joined by downward arrows.
Growth curves
Panel c plots organoid diameter against day, one curve per tissue origin, with the legend set inside the axes.
Capture rate bars
Panel d gives four bars for four loading conditions, with the capture rate on the vertical axis.
Live fluorescence view
Panel e shows bright spots on a dark field for the occupied traps, and it still needs a scale bar.
Workflow colours
The four blocks change colour down the column and the arrows run one way, marking the process as neither reversible nor branching.
Where it is used
- Paper mechanism figure
- Defense slides
- Academic poster
- Lab website
What reviewers look for
The trapping mechanism is vague
Organoids simply rest against the inner wall, so nothing shows whether posts, pockets or hydrodynamic forces hold them in place. That mechanism decides whether capture is reproducible, and it must be drawn.
Growth curves lack error
All three curves are smooth, monotonic lines with no error bars and no count of organoids per group, which is not enough to claim a difference between tissue origins.
Define the capture rate
The axis says capture rate without saying whether it means the fraction of loaded organoids or the fraction of traps occupied. The two give quite different numbers, so define the one you used in the caption.
The fluorescence view floats free
Four bright spots appear with no scale bar and no channel outline around them, so they cannot be matched to any of the positions in the array drawn in the first panel.
How to use it in Yila
- 1Pick a figure
- 2Describe your subject and the steps to stress
- 3Refine it in chat, then download the PNG
Tips
Do
- Draw the real trap geometry in the first panel, even as a zoom on a single bend rather than along the whole channel.
- Use the same four words in the workflow blocks as the subheadings in your methods, so readers can map them directly.
- Give the three tissue origins and the fluorescence view one shared palette, so that each bright spot has a visible group.
Avoid
- Do not let the panel letter sit on top of its own title, as it does on the first panel; separate the two before layout.
- Do not space the trapped organoids perfectly evenly, because real arrays fill unevenly and tidy spacing looks staged.
Questions
Can this go straight into a paper?
Use it as a layout skeleton. The curves, bars and the fluorescence field are AI-generated illustration, so replace them with your own data, add the trap geometry, error bars and a scale bar, and then keep refining type sizes and colours in Yila before you submit anything.
Can elements in the figure be changed?
Not element by element, but you can keep refining it by chatting in Yila: turn the serpentine into a post array, add another loading condition, replace the growth curves with box plots, or keep only the first two panels, then generate a new version.
What format is delivered?
An AI-generated PNG image in a 4:3 landscape layout. It is not a vector graphic, so the text inside the workflow blocks and the axis ticks soften when the image is reduced; check it at the size it will take in a paper or on a poster.
Is it free?
Viewing this page and the sample figure costs nothing. Generating a version in Yila consumes credits, and a new account receives 2,500 credits, which is enough to rework the trap geometry, the panel order and the palette before settling on a methods figure.
I trap single cells rather than organoids. Does it still work?
Yes. Replace the clusters in the channel with single cells, and the growth curves with viability or division counts. An array panel, a workflow and a row of statistics suit capture experiments at either scale equally well.
Can I keep just the capture rates and the fluorescence view?
Ask for those two panels side by side and drop the rest of the page. Together they make one complete point, that a given loading condition fills the most traps with living tissue, which is about as much as one defense slide should carry.