Figure template · Workflow · 4:3
Multicolor Flow Cytometry Workflow Figure
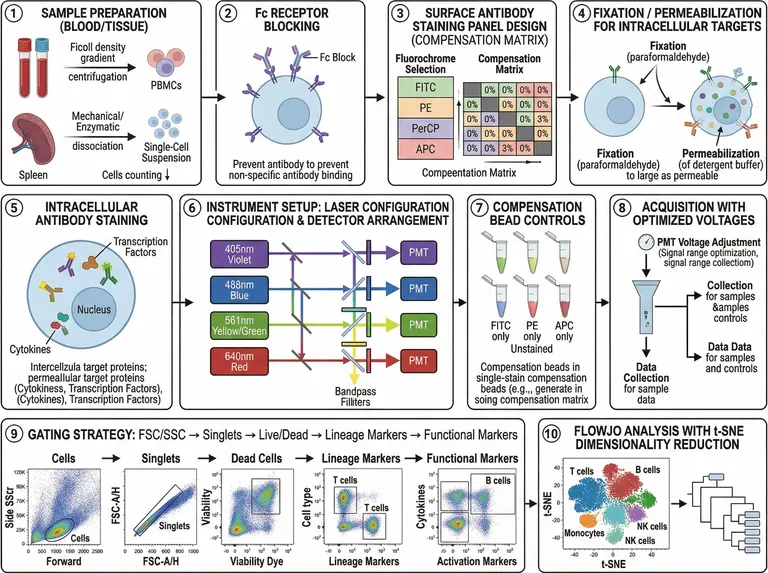
A landscape figure of ten numbered panels that walks a multicolor flow experiment from blood and spleen preparation through staining, compensation and acquisition to hierarchical gating and t-SNE clustering, built for methods figures in immunology papers and thesis defenses.
Prompt
Create a scientific figure about: Multicolor flow cytometry workflow covering staining, acquisition, gating, and statistical analysis. Visual style: Clean Vector. Requirements: publication-ready scientific quality, clear labels and directional arrows where appropriate, avoid cartoon or stock-photo look, composition optimized for research papers and academic slides.
What this template is
Three rows of numbered panels follow one experiment. PBMCs come off a density gradient while spleen is dissociated to a single-cell suspension; Fc receptors are blocked, surface antibodies are chosen against a compensation matrix, and cells are fixed and permeabilized before cytokines and transcription factors are stained. The cytometer then gets four lasers with matched detectors, single-stain bead controls and tuned PMT voltages. Gating runs from scatter to singlets, viability, lineage and functional markers, and a t-SNE map closes the sequence, so a reader sees why each step sits where it does.
Elements to label
Sample preparation
Keep the two arms separate: density-gradient PBMCs from blood, mechanical or enzymatic dissociation for spleen.
Fc receptor block
Label the blocking antibody with its purpose, reducing non-specific binding; the sample caption repeats a word and needs rewriting.
Panel and compensation matrix
List FITC, PE, PerCP and APC down the side, leave the diagonal blank and fill the other cells with spillover values.
Fixation and permeabilization
Give paraformaldehyde fixation and detergent permeabilization one arrow each; the sample text in this panel is garbled.
Intracellular staining
Point transcription factors toward the nucleus and cytokines into the cytoplasm, and rewrite the misspelled caption beneath.
Laser and detector path
Violet, blue, yellow-green and red beams pass dichroic mirrors and bandpass filters to their own photomultiplier tubes.
Compensation beads
One single-stain tube per fluorochrome plus an unstained tube, captioned as the input for the compensation matrix.
Hierarchical gating
Successive dot plots box cells, singlets, live cells, lineage-positive and marker-positive events, with axes named after your panel.
Where it is used
- Paper mechanism figure
- Defense slides
- Course handout
- Academic poster
What reviewers look for
The viability gate is on the wrong cloud
In the third dot plot the gate encloses the viability-dye-bright population, which is the dead fraction. Downstream gating should continue from the dye-negative live cells, so correct this plot before anything else.
Where the spillover values come from
The matrix values are placeholders. A reviewer will ask whether compensation came from single-stained beads or cells and whether it was applied at acquisition or in analysis, so state both in the legend and the methods.
Lasers match fluorochromes
FITC and PerCP are excited by the blue laser, APC by the red, and PE by blue or yellow-green. Trace each beam in the optical panel to confirm its detector serves a dye in your panel.
Labels on the t-SNE map
NK cells are labelled twice and the axis ticks carry no biological meaning. Merge the duplicate label, drop the ticks and state in the legend which markers fed the embedding.
How to use it in Yila
- 1Pick a figure
- 2Describe your subject and the steps to stress
- 3Refine it in chat, then download the PNG
Tips
Do
- Put your own antigen and fluorochrome pairs in the prompt so the matrix and gating axes show real markers.
- For a surface-only panel, ask Yila to drop the fixation and intracellular panels and tighten the remaining rows.
- State which gate each downstream plot inherits from, so the regenerated gating row keeps parent and child populations in the right order.
Avoid
- Do not keep the analysis software named in the tenth panel title; name the pipeline your methods section actually describes.
- Do not squeeze all ten panels into a single column; keep staining, acquisition and gating, or the dot plots become unreadable.
- Do not leave the placeholder spillover percentages on the matrix; replace them with values from your own single-stain controls or remove them.
Questions
Can I drop this straight into my methods section?
Use it as a working draft. It is an AI-generated image with several misspelled captions and a viability gate drawn on the dead cells, so check every panel's wording and gating logic against your protocol, then keep refining it in chat until the journal's requirements are met.
Can I swap in my own antibody panel and gating order?
Not element by element, but you can refine it by chatting in Yila. Give it your fluorochrome and antigen pairs, the gating hierarchy and the subsets you report, and it will regenerate the compensation matrix, optical path and dot plots to match.
What file do I get?
An AI-generated PNG image in a 4:3 landscape frame that suits slides and supplementary material. It is not a vector graphic, and the small text in the dot plots softens when enlarged, so check legibility at your final size first.
Is it free to use?
Opening this page and viewing the sample cost nothing. Generating or revising your version in Yila consumes credits, and a new account receives 2,500 credits, enough to iterate several times on your own staining panel.
Does it work for spectral cytometry?
Yes, with a few changes stated in the conversation: replace the compensation matrix with spectral unmixing, turn the bead tubes into single-stain reference controls and redraw the optics as a detector array. Sample preparation, staining and the gating row can stay as they are, since those steps do not change between instrument types.
Can I get only the gating strategy row?
Ask for the gating section on its own, with each gate drawn as a separate dot plot that names the gate, its parent population and the two parameters on its axes. That gives the gating-strategy figure many journals expect in the supplement, which you can then adjust further.