Figure template · Workflow · 4:3
Multi-Agent Workflow for Literature Processing
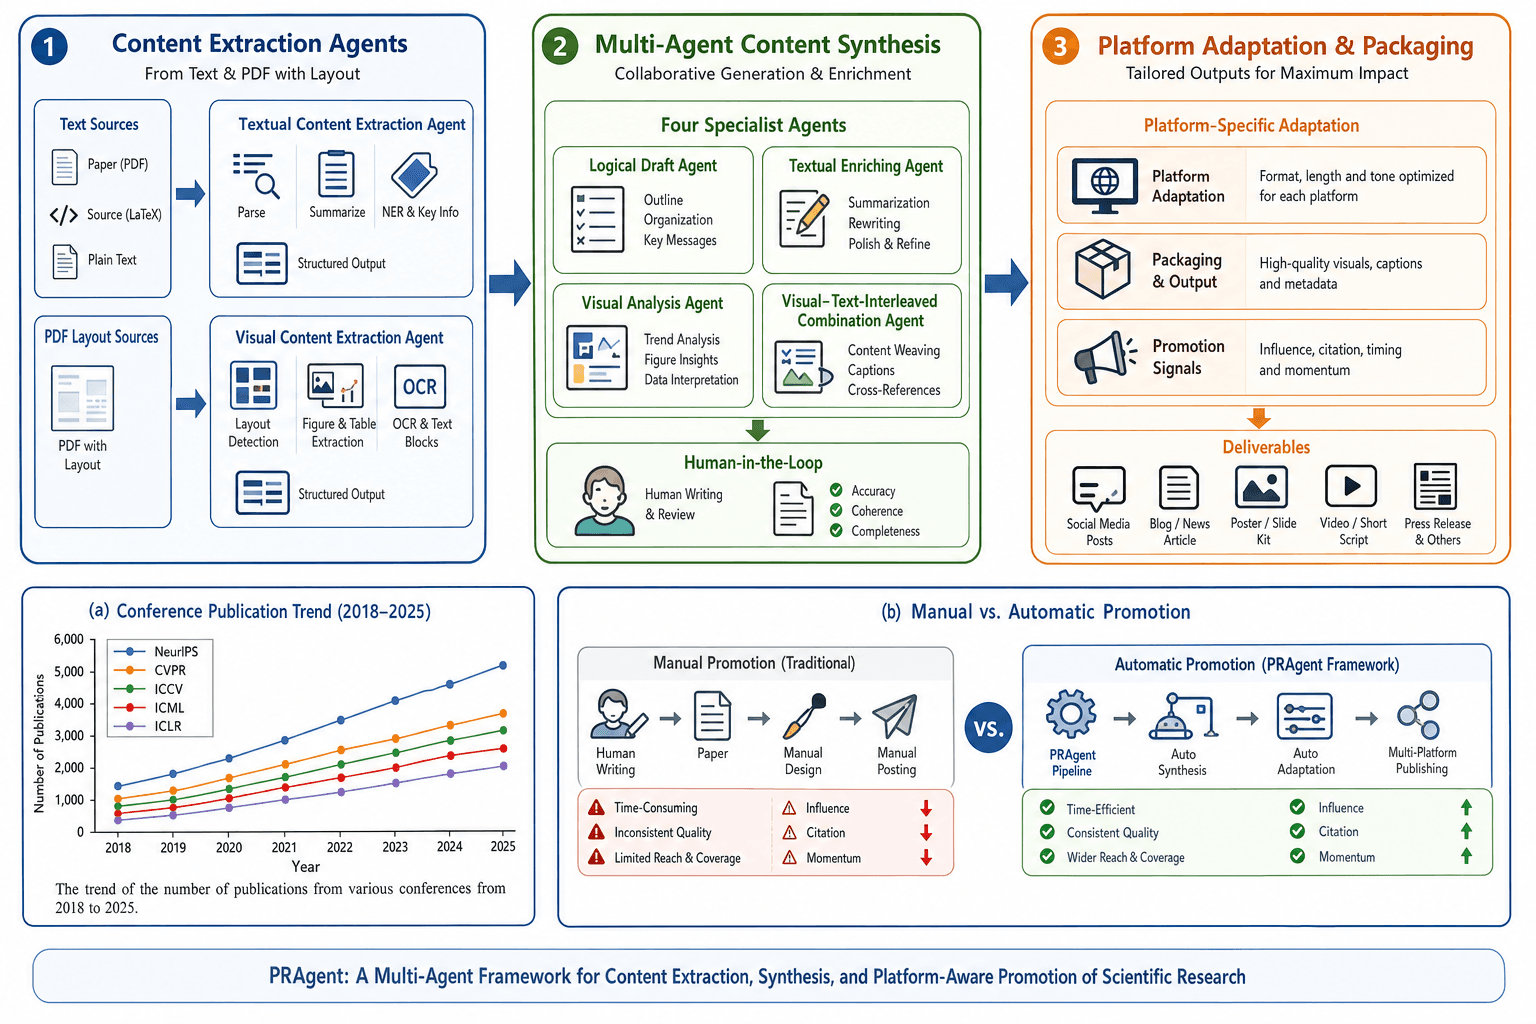
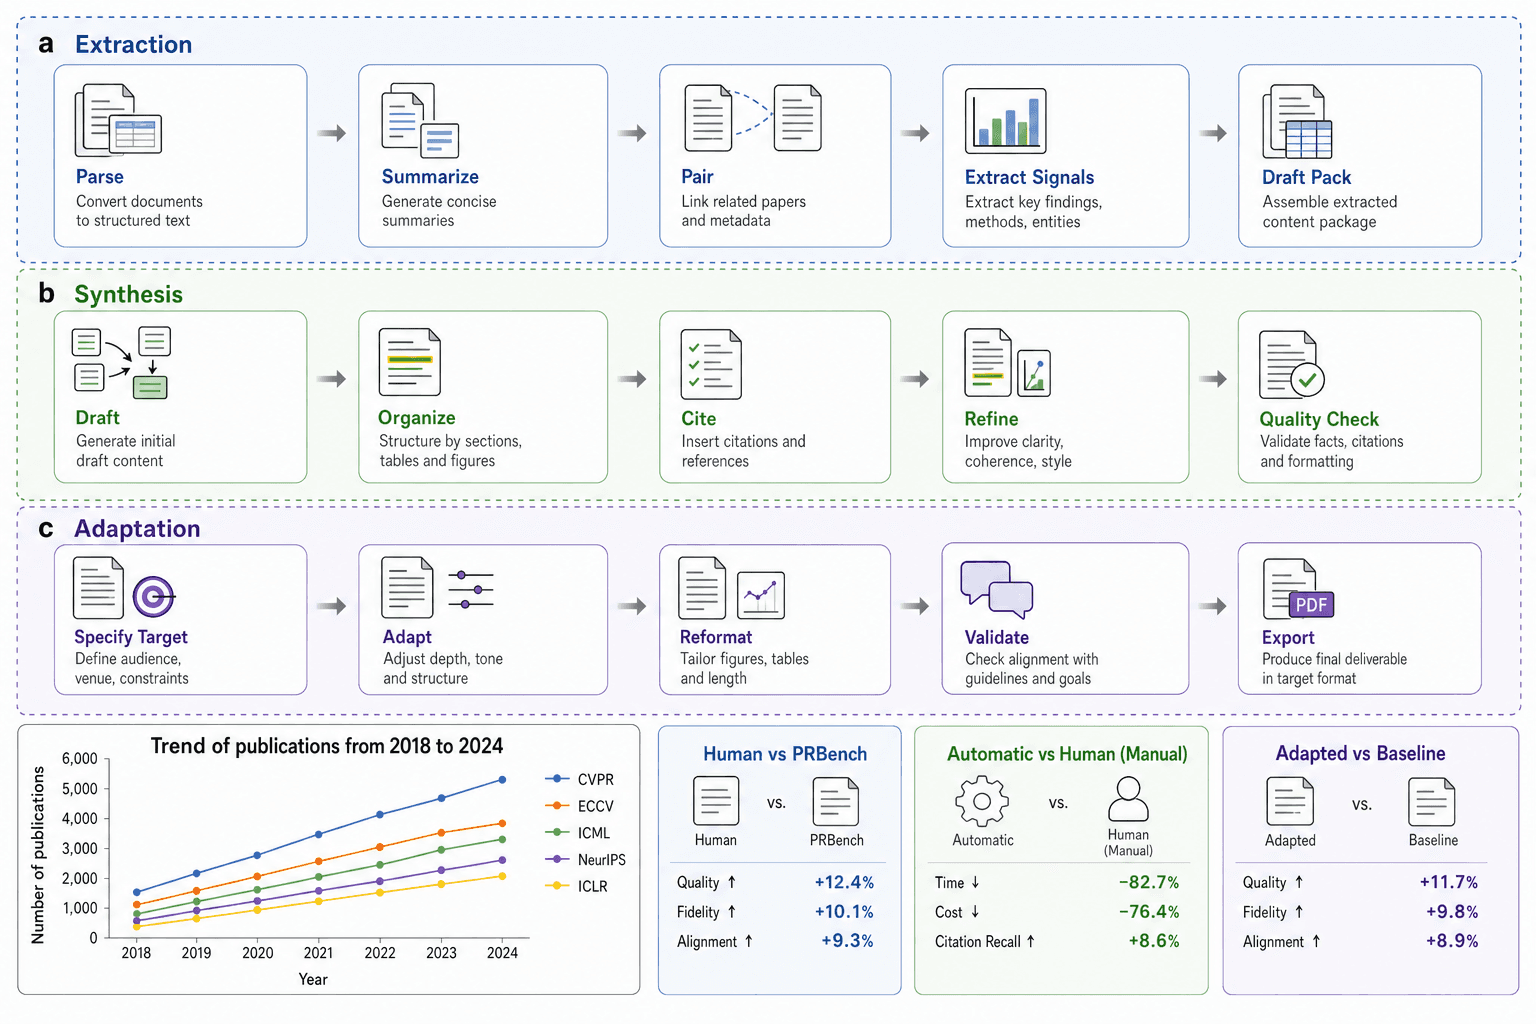
Three dashed lanes for extraction, synthesis and adaptation, each with step cards moving left to right, above a row holding a trend chart and three comparison cards, laid out for the methods overview of an agent-system paper or a defense talk.
Prompt
Create a scientific figure about: Multi-agent workflow of retrieval, planning, tool use, and review. Visual style: Clean Vector. Requirements: publication-ready scientific quality, clear labels and directional arrows where appropriate, avoid cartoon or stock-photo look, composition optimized for research papers and academic slides.
What this template is
The figure splits a literature-processing system into three pipelines. Extraction parses documents, summarizes them, links related papers and pulls out key findings into a draft pack. Synthesis drafts, organizes sections, inserts citations, refines the prose and runs a quality check. Adaptation fixes the audience and venue, adjusts depth, reformats figures and tables, validates against guidelines and exports a PDF. The bottom row hints at results with a line chart and comparison cards. A reader should come away knowing what each lane takes in and hands on, and that review happens at two points rather than once at the end.
Elements to label
Lane headers
A letter and lane name at the upper left of each band, each lane in its own color that the card titles repeat.
Retrieval and pairing card
The pair step in the extraction lane links two papers with a dashed curve, standing in for retrieval.
Planning card
Specify target opens the adaptation lane by fixing audience, venue and constraints, the closest thing to a planning step.
Tool-use output
The export card carries a PDF badge; note beside it which typesetting or conversion tool is called.
Review cards
Quality check ending synthesis and validate in adaptation, both marked with check icons as the two review points.
Step arrows
Short grey arrows join the cards within a lane; hand-offs between lanes need arrows of their own.
Trend chart
Five rising lines of publication counts by year; the legend names must be replaced with your own data sources.
Comparison cards
Each pits two setups against each other on three metrics with up or down arrows; all percentages shown are placeholders.
Where it is used
- Paper mechanism figure
- Defense slides
- Academic poster
- Lab website
What reviewers look for
Where are the agents
The sample draws fifteen step cards but never says how many agents share the work or who owns which lane; reviewers of a multi-agent paper look first for role assignment and the messages passed between roles.
Make retrieval and tools explicit
Retrieval, planning and tool use are only implied by the pair, specify-target and export cards; draw the retrieval sources, the plan being produced and the external tools as their own elements so the control flow is visible.
What happens on a failed check
After quality check and validation the arrows only continue to the right, with no path back when a check fails; a system with feedback should show that return route and state its retry limit.
The numbers are not yours
The venue names, years and percentages in the bottom row were filled in during generation; reviewers will read them as results, so replace them with your measurements or delete the whole row.
How to use it in Yila
- 1Pick a figure
- 2Describe your subject and the steps to stress
- 3Refine it in chat, then download the PNG
Tips
Do
- List each agent's name and responsibility in the prompt and ask for every lane to show which agent runs it.
- Draw the fallback after a failed review as a dashed arrow, so it reads differently from the forward steps.
- Ask for the retrieval sources, such as a paper index or the web, as labelled boxes at the left edge of the extraction lane.
Avoid
- Do not keep the names and figures in the bottom chart and cards; they come from no real experiment.
- Avoid two-line captions on all fifteen cards, since they blur together once the figure is reduced to page width.
Questions
Can this workflow figure go straight into a paper?
Not as it stands. It is an AI-generated raster image that draws no agent roles, and the venue names and percentages at the bottom are placeholders; use it as a layout reference and finalize it only after swapping in your system's real modules and measured results.
Can elements in the figure be changed?
Not element by element, but you can keep refining it by chatting in Yila: turn the three lanes into retrieval, planning, execution and review agents, drop the data row, or add fallback arrows after each check, then generate a new version.
What format is delivered?
An AI-generated PNG image in 4:3 landscape. It is not a vector graphic, and the two-line card captions and the chart ticks become hard to read when reduced, so check them at the real width of a two-column page before submitting anything, and enlarge the lane titles if they fade.
Is it free?
Viewing this page and the sample costs nothing. Generating your own workflow figure in Yila consumes credits, and new accounts receive 2,500 credits, enough to settle the lane and card structure first and add the detail afterwards.
I only need the workflow lanes. Is that possible?
Yes. Ask for the trend chart and comparison cards to be removed, keeping the three lanes. The lanes then gain vertical room, so each card can carry a more specific description of what that step does in your system, and the agent names can sit beside each lane header.
Can it be drawn around a central orchestrator?
Yes. Ask for a star layout with an orchestrating agent at the center and retrieval, planning, tool-use and review agents around it, joined by two-way arrows for task dispatch and returned results, which suits systems with a single controller.