Figure template · System & Network · 4:3
Spatial Tissue Neighborhood Map of a Tumor Section
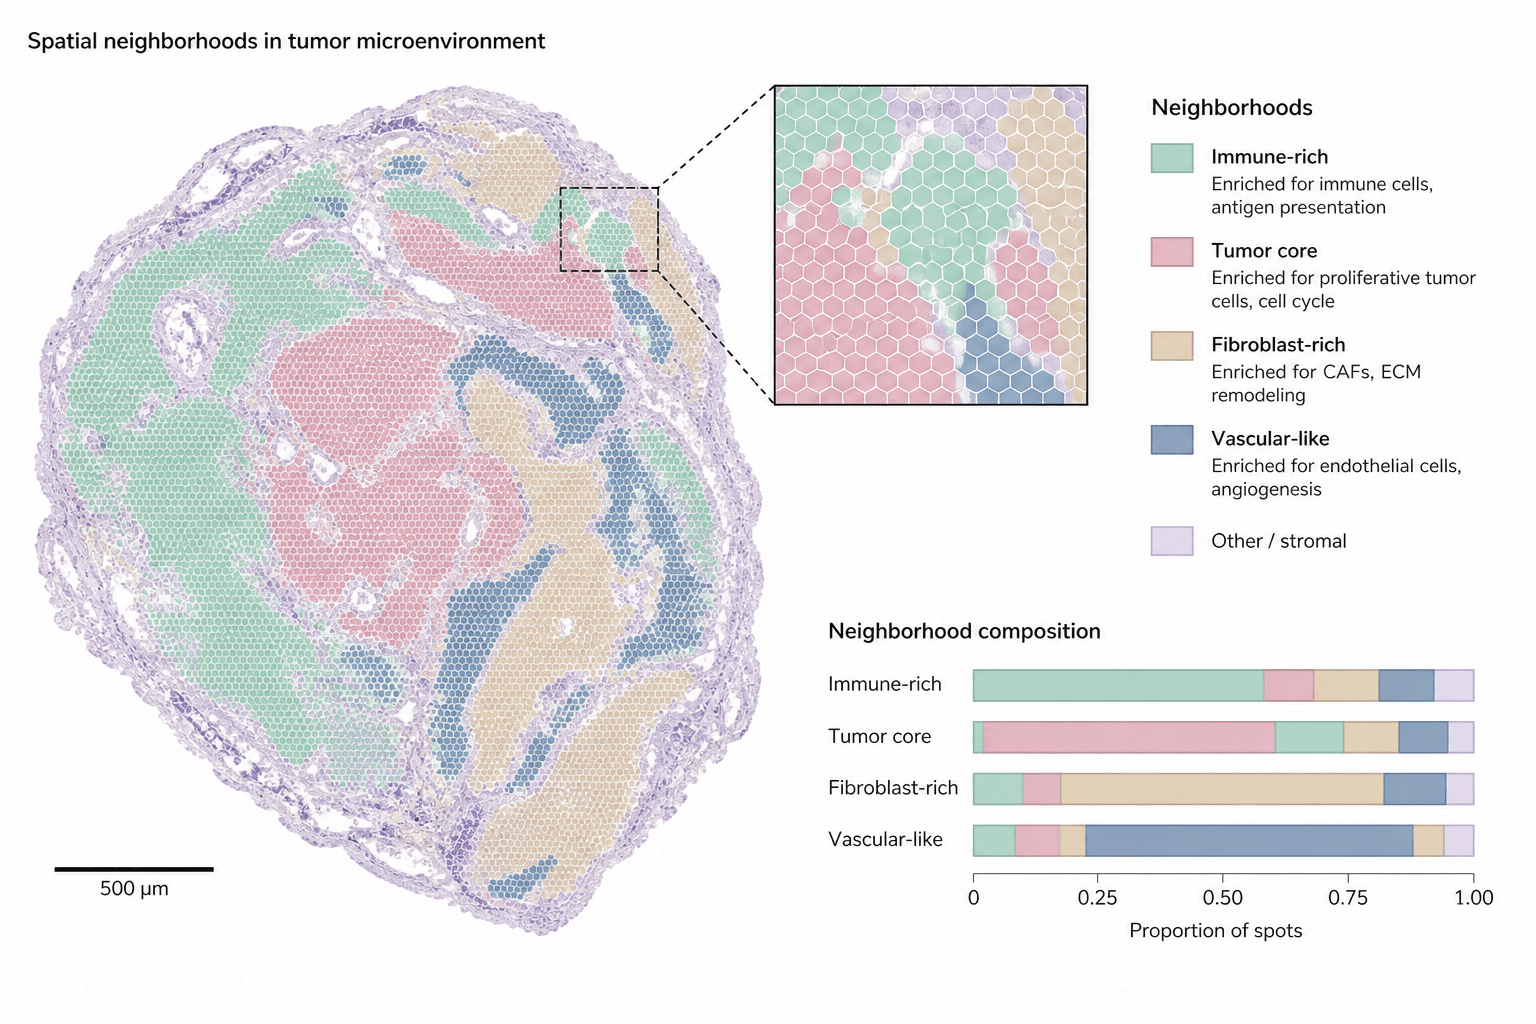
A landscape figure pairing a whole tumor section colored by neighborhood with a zoomed inset of hexagonal spots and stacked composition bars, built for the results figure or graphical abstract of a spatial omics study.
Prompt
Create a scientific figure about: Tissue neighborhood map with color-coded cell states. Visual style: Clean Vector. Requirements: publication-ready scientific quality, clear labels and directional arrows where appropriate, avoid cartoon or stock-photo look, composition optimized for research papers and academic slides.
What this template is
The figure carries one recurring spatial-omics finding: tissue does not mix evenly but sorts into neighborhoods defined by cell state. Across the section, immune-rich, tumor-core, fibroblast-rich and vascular-like regions each take one muted color, wrapped by a pale rim of other stroma. A reader should come away able to say which neighborhoods border the tumor core, and from the bars at the lower right, which component dominates inside each neighborhood. The inset shows that the map is built from individual spots rather than drawn freehand.
Elements to label
Whole-section outline
The large map keeps the tissue's shape and lumens; the title above it should name the tumor type and assay.
Neighborhood colors
Five low-saturation fills, one per neighborhood, named once in the legend and nowhere else.
Other-stroma rim
A pale lilac band around the section edge and between regions; keep it lighter than every named neighborhood so it reads as background.
Hexagonal spots
Each hexagon in the inset is one capture spot; state its physical diameter in the caption.
Zoom inset
Dashed lines lead from a small box on the section to the enlarged view, ideally placed where three neighborhoods meet.
Neighborhood legend
Under each swatch, one line names the enriched cell types or programs, such as antigen presentation or angiogenesis.
Scale bar
Redraw the bar with the length measured on your own section; the sample value is a placeholder.
Composition bars
The x-axis is the proportion of spots, one row per neighborhood, listed in the same order as the legend.
Where it is used
- Paper mechanism figure
- Graphical abstract
- Academic poster
- Lab website
What reviewers look for
What the bars actually divide
The sample bars split each neighborhood using the neighborhood colors themselves, which is circular; reviewers expect cell-type proportions within each neighborhood, so the segments should be recolored by cell type.
How neighborhoods were called
Say whether neighborhoods come from clustering spot expression directly or from deconvolved cell types pooled over a spatial window, and how the number of clusters was chosen, or the coloring cannot be reproduced.
Scale bar against spot size
The scale bar, the hexagon diameter and the inset magnification must agree with one another; the sample ticks are placeholders, so recheck all three after entering your platform's parameters.
One section is not a pattern
A claim such as immune regions encircling the tumor core needs several samples behind it; with a single section shown, the caption should call it representative and give the total sample count.
How to use it in Yila
- 1Pick a figure
- 2Describe your subject and the steps to stress
- 3Refine it in chat, then download the PNG
Tips
Do
- Give the prompt your actual neighborhood names and count, so the legend rows and the bars match your clustering output.
- Ask for the inset to sit on a boundary, where one small view can show whether neighborhoods grade into each other or meet sharply.
Avoid
- Avoid fills of nearly equal lightness; in grayscale or for color-blind readers the tumor core and immune regions will merge.
- Do not keep the sample scale value or axis ticks, because readers will take them as measurements from your data.
Questions
Can this neighborhood map go straight into a paper?
Treat it as a first draft of a results panel or graphical abstract. It is an AI-generated raster image whose section shape, spot pattern and bar lengths are illustrative rather than measured, so replace them with your own analysis output, or at the very least verify the scale bar, the axis ticks and every legend entry one by one before submission.
Can elements be changed, for example adding a neighborhood?
Not by dragging individual elements, but you can keep refining it by chatting in Yila: add a tertiary lymphoid neighborhood, move the inset to a different boundary, rename the legend entries to match your clusters, or split the bars by cell type, then generate a new version from that description.
What format is delivered?
An AI-generated PNG image in a 4:3 landscape layout. It is not a vector graphic, so hexagon outlines and small legend text thin out and blur when the figure is reduced; check legibility at the final column width before placing it in a multi-panel layout, and ask for a larger legend font if needed.
Is it free to use?
Viewing this page and the sample costs nothing. Generating your own version in Yila consumes credits, and new accounts receive 2,500 credits, enough to try a few palettes, inset positions and neighborhood schemes before you settle on the version that goes into the manuscript.
My data are single-cell resolution imaging. Does it still fit?
Yes. Ask for segmented cell outlines in place of capture spots and for individual cells rather than hexagons inside the inset; the neighborhood coloring, the legend with its enrichment notes and the composition bars can all stay as they are, since they describe the analysis rather than the assay.
Can I keep only the section map?
Ask for the inset and the bars to be removed, leaving the section and its legend. A single map works well as one panel of a larger multi-panel figure, with neighborhood composition plotted separately from your real spot or cell counts so that the numbers in the bars are your own.