Figure template · Workflow · 4:3
Four-Panel Methods Board from Isolation to Readout
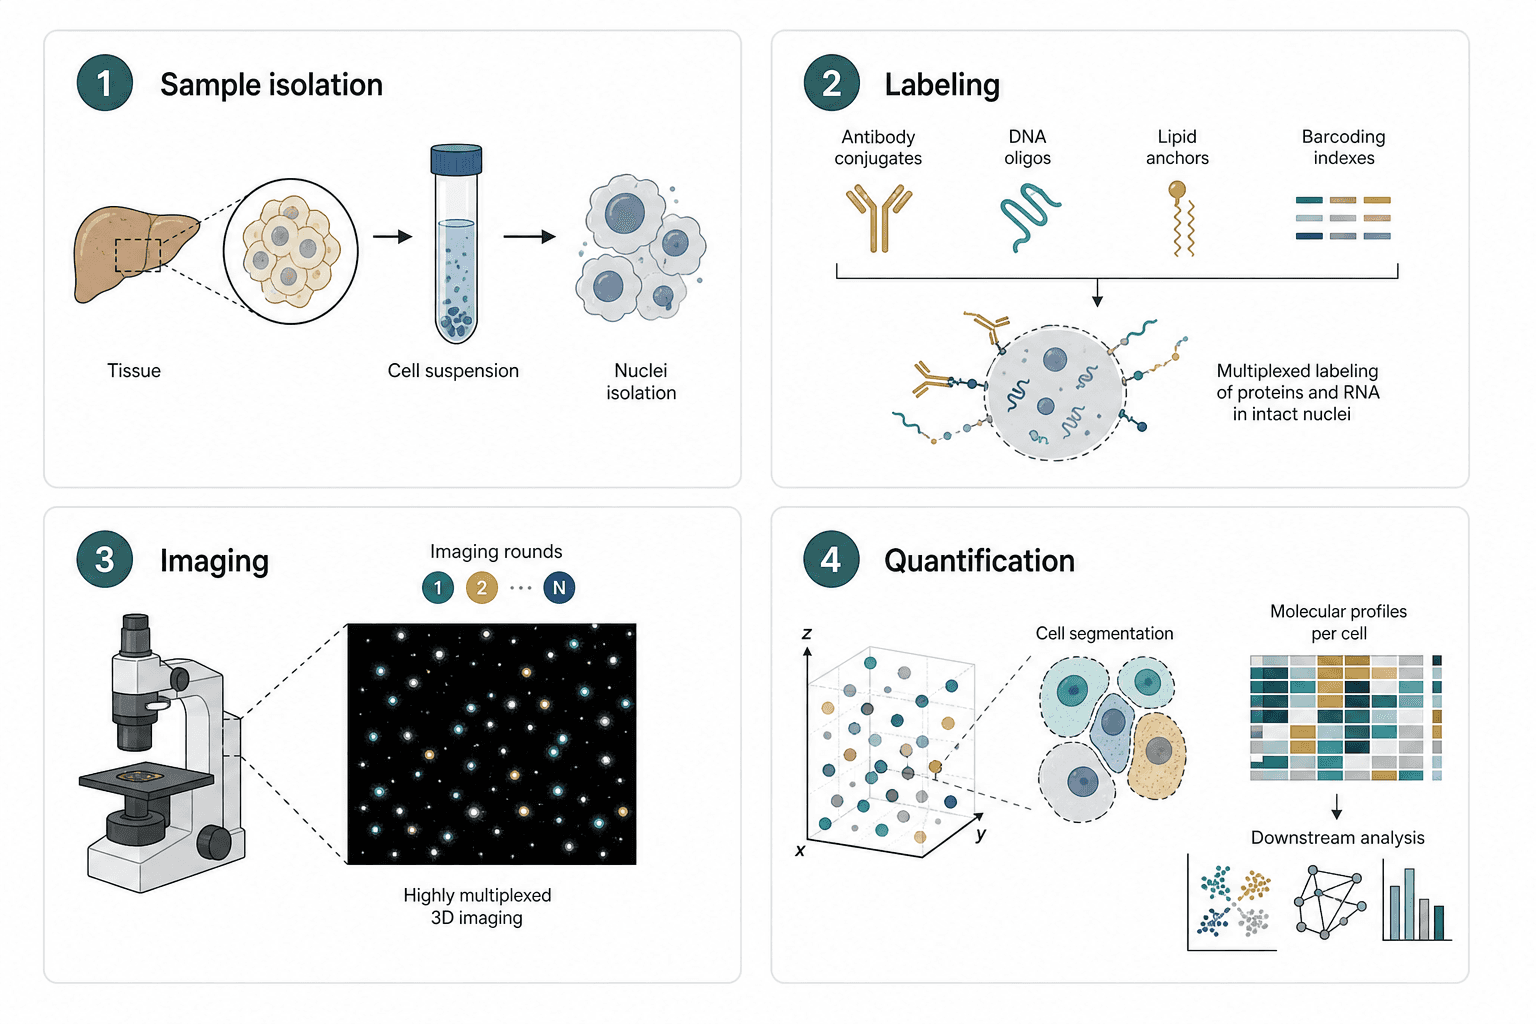
Four numbered panels in a two-by-two grid walk through sample isolation, labeling, imaging and quantification, with small arrows linking the sub-steps inside each panel, sized for a methods overview figure or the workflow page of a grant proposal.
Prompt
Create a scientific figure about: Four-panel methods board from isolation to readout. Visual style: Clean Vector. Requirements: publication-ready scientific quality, clear labels and directional arrows where appropriate, avoid cartoon or stock-photo look, composition optimized for research papers and academic slides.
What this template is
The board condenses a multiplexed imaging experiment into four moves. Tissue is dissociated into a cell suspension and nuclei are isolated; several probe classes then label proteins and RNA at once; the sample is imaged over repeated rounds that record fluorescent spots in three dimensions; finally single cells are segmented in that coordinate space and summarized as per-cell molecular profiles that feed clustering, network and statistical analysis. After reading it, a viewer should know what physical form the sample takes in each panel and in which panel data first appear, without needing the methods text to follow the order.
Elements to label
Numbered panel headers
A dark numbered disc in each corner, followed by a one-word step name such as isolation or labeling.
Tissue-to-nuclei chain
Organ outline, circular zoom, centrifuge tube and nuclei in a row, each with a single noun beneath it.
Four probe classes
Antibody conjugates, DNA oligos, lipid anchors and barcoding indexes side by side, each in a distinct color.
Labeled nucleus
A dashed circle for an intact nucleus with probes attached around its envelope, plus a one-line result note beside it.
Imaging rounds
Small discs marked one, two and N with an ellipsis between them, showing that the round count follows the design.
Dark-field spot view
Colored puncta on a black square, linked by dashed lines to the microscope stage they were acquired from.
3D coordinates and segmentation
A point cloud inside an axis-labeled cube, with dashed lines leading to a few segmented cell outlines.
Per-cell profiles and analysis
A heatmap with one row per cell, above thumbnails for clustering, a network and a bar summary.
Where it is used
- Paper mechanism figure
- Grant proposal
- Defense slides
- Course handout
What reviewers look for
Nuclei or whole cells
The first panel says nuclei isolation, yet its icon and the segmented objects in the last panel are whole cells with cytoplasm; for a single-nucleus workflow, draw bare nuclei throughout or reviewers will question the sample type.
How rounds decode barcodes
State how repeated rounds read out the barcodes, whether by stripping and re-hybridizing or by switching fluorescent channels each round, otherwise readers cannot connect the round discs to the barcoding indexes.
Probe-to-target mapping
Antibodies detect proteins, oligos detect RNA and lipid anchors mark membranes; write these pairings into the labeling panel so the four probe classes do not appear to target the same molecule.
Organ and species
The sample shows a liver-like organ outline; if your material comes from another organ or species, have it replaced in chat and name the source tissue and dissociation method in the caption.
How to use it in Yila
- 1Pick a figure
- 2Describe your subject and the steps to stress
- 3Refine it in chat, then download the PNG
Tips
Do
- Name your actual probe types and number of imaging rounds in the prompt, so the labeling row and round discs match the experiment.
- Keep one result sentence per panel and move protocol details to the caption, so the four panels carry similar amounts of text.
- Ask for the organ outline and nuclei in the first panel to match your real sample before you refine anything else on the board.
Avoid
- Do not present the analysis thumbnails in the last panel as results; they are placeholders to remove or replace with your own plots.
- Avoid adding arrows between the panels, since the numbers already set the order and extra connectors crowd the grid.
Questions
Can this methods board go straight into a paper?
Use it as a draft of the methods overview. It is an AI-generated raster image in which probe shapes and cell morphology are schematic, so check each panel's terms, the sample type and the step order against your written methods, line by line, before it goes into a submission.
Can elements in the figure be changed?
Not element by element, but you can keep refining it by chatting in Yila: swap the organ for a tumor biopsy, drop the lipid anchors, switch imaging to two dimensions, or replace the readout panel with sequencing, and then generate a new version from that request.
What format is delivered?
An AI-generated PNG image in a 4:3 landscape layout. It is not a vector graphic, and probe labels and the small heatmap blur when the board is reduced to half a column, so check that every word is still readable at the size your layout will use.
Is it free?
Viewing this page and the sample is free of charge. Generating your own version in Yila consumes credits, and new accounts receive 2,500 credits, enough to rework the four panels around your own protocol over several rounds of revision, including probe names and the readout.
My workflow has five steps. Can it become five panels?
Yes. Give the number of steps and their names in chat and ask for a single row or a two-plus-three arrangement. With more panels, each one needs fewer words, or the labels become hard to read once the figure shrinks to page width.
Does it work for a sequencing-based assay?
Yes. Keep the isolation and labeling panels, replace imaging with library preparation or sequencing, and swap the point cloud for a read-alignment sketch; the per-cell profile heatmap and the downstream analysis thumbnails can stay largely as they are.