Figure template · Cross-section · 4:3
Hypoxic Stroma Niche Cross-Section of a Tumor
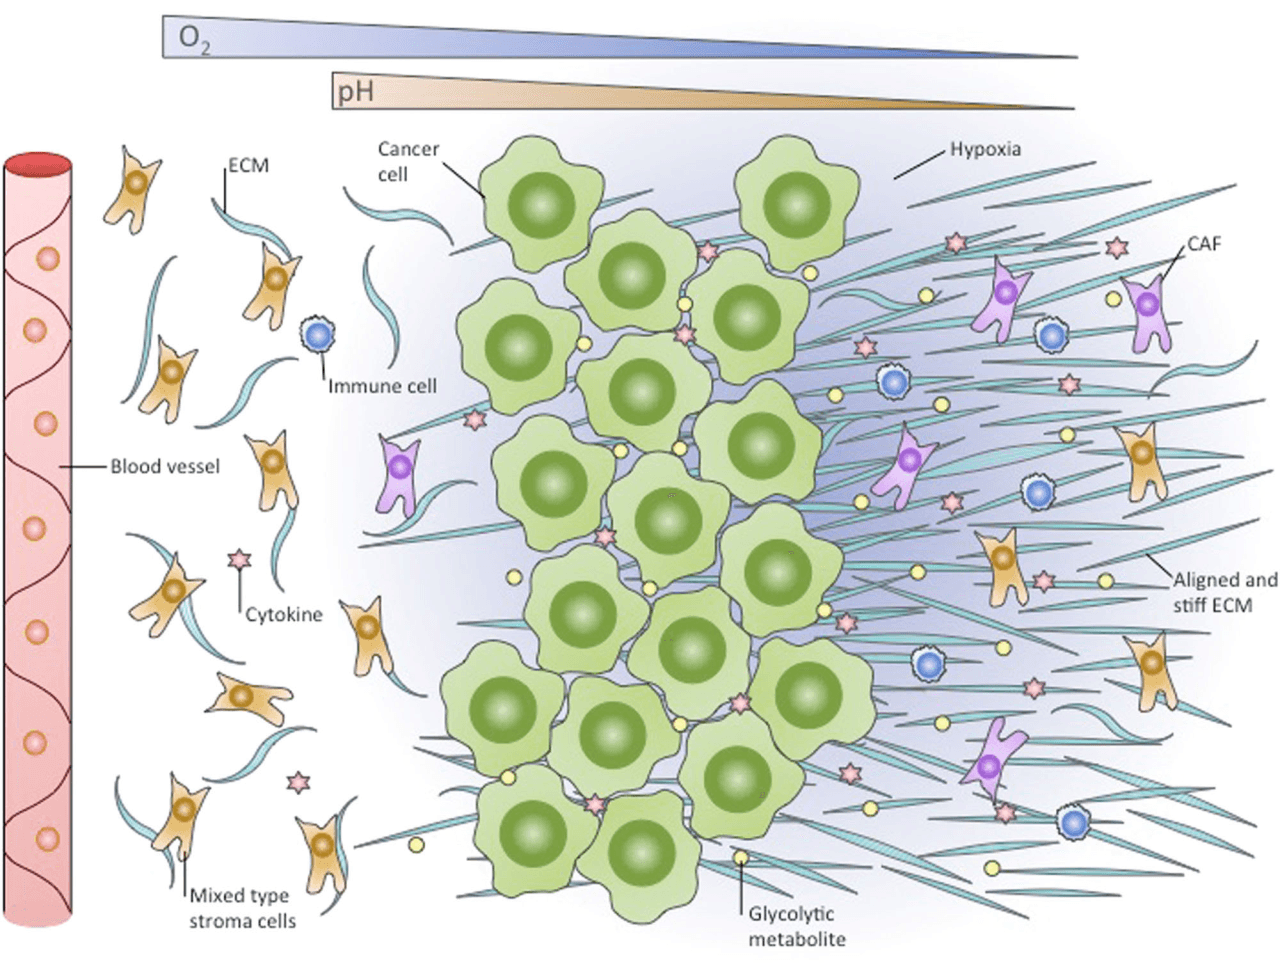
A continuous cross-section from a blood vessel at the left to a hypoxic zone at the right, with two tapering bands for falling oxygen and pH and stromal fibers that change from loose and curved to straight and dense, suited to a tumor-microenvironment mechanism figure.
Prompt
Create a scientific figure about: Oxygen gradient and stiff hypoxic stroma in the tumor niche. Visual style: Clean Vector. Requirements: publication-ready scientific quality, clear labels and directional arrows where appropriate, avoid cartoon or stock-photo look, composition optimized for research papers and academic slides.
What this template is
The cross-section lays the tumor niche out by distance from a vessel. Near the vessel, oxygen is plentiful and stromal cells and extracellular matrix fibers lie loosely; in the middle, cancer cells pack into a dense mass surrounded by glycolytic metabolites and cytokines; further right, oxygen and pH fall, the background takes on a hypoxic tint, the matrix fibers straighten and stiffen, and cancer-associated fibroblasts become more frequent. A reader should come away connecting hypoxia, acidification and matrix remodeling along one spatial gradient, rather than treating them as separate features of the tumor.
Elements to label
Oxygen wedge
A blue band at the top that narrows from left to right, labelled with the chemical formula; add high and low at the ends.
pH wedge
A second, orange band running the same way, showing the extracellular space growing more acidic.
Blood vessel
A vertical red tube with blood cells at the left edge, the origin of the gradient, labelled outside its wall.
Cancer-cell mass
Tightly packed green cells in the middle; point the leader line at a single cell so it hides nothing.
Hypoxic zone
A blue-violet haze at the right, labelled inside the haze where the oxygen wedge is thinnest.
Aligned, stiff ECM
Long parallel fibers at the right, contrasting with curved loose fibers near the vessel; the label names both alignment and stiffness.
Cancer-associated fibroblasts
Purple stellate cells gathered on the hypoxic side, colored apart from the mixed stromal cells near the vessel.
Metabolites and cytokines
Yellow dots for a glycolytic metabolite and pink stars for cytokines; name the molecules in the caption.
Where it is used
- Paper mechanism figure
- Graphical abstract
- Grant proposal
- Course handout
What reviewers look for
Gradients without a scale
The two wedges give direction only, with no distance or values; if the paper discusses oxygen diffusion distance, add a distance bar measured from the vessel and define the threshold used for hypoxia.
How stiffness was shown
Aligned fibers are a description of shape, while stiffness is a mechanical property; reviewers will ask whether it rests on atomic force microscopy, collagen cross-linking markers or LOX expression, so name the evidence.
Where immune cells sit
The sample scatters immune cells evenly on both sides, whereas hypoxic regions usually exclude or suppress them; if your data agree, thin them out on the hypoxic side or redraw them as suppressive subsets.
Metabolite and HIF-1α link
The yellow dots are labelled only as a glycolytic metabolite, best stated as lactate; if the paper ties hypoxia-driven glycolysis to matrix remodeling, a HIF-1α mark inside the cancer cells joins the two.
How to use it in Yila
- 1Pick a figure
- 2Describe your subject and the steps to stress
- 3Refine it in chat, then download the PNG
Tips
Do
- Name your tumor type and hypoxia marker in the prompt, so cell shapes and caption terms follow them.
- Ask for loose and stiff fibers in one color with different arrangement; the contrast reads more directly than a color change.
- Ask for a distance bar from the vessel along the bottom edge, so the length of the gradient has a reference a reader can use.
Avoid
- Do not leave the black bands above and below the sample; crop them before placing the figure in a paper.
- Avoid drawing cytokines and metabolites at the same size and density, which implies identical concentration profiles.
Questions
Can this cross-section go straight into a paper?
It is a starting point for a mechanism schematic. It is an AI-generated raster image whose gradients have no scale, and the immune-cell distribution and the metabolite name need checking against your data before it becomes a final figure labelled as a schematic in the caption.
Can elements in the figure be changed?
Not element by element, but you can keep refining it by chatting in Yila: add a distance bar along the bottom, replace immune cells on the hypoxic side with suppressive subsets, mark HIF-1α inside the cancer cells, or drop the pH wedge, then generate a new version.
What format is delivered?
An AI-generated PNG image in a near-square landscape layout with black bands at the top and bottom. It is not a vector graphic, and the fine fibers and labels run together when reduced, so crop the bands and check the figure at its final size before submission.
Is it free?
Viewing this page and the sample costs nothing. Generating your own version in Yila consumes credits, and new accounts receive 2,500 credits, enough to adjust cell types, gradient labels and colors to your project over several rounds.
Can angiogenesis be added?
Yes. Ask for thin sprouting vessels at the edge of the hypoxic zone, with arrows from the hypoxic cancer cells toward them labelled with a pro-angiogenic factor, so hypoxia and new vessel growth sit on one causal chain. Keep the new vessels thinner than the main one so the gradient's origin stays clear.
I study fibrosis, not cancer. Can it be adapted?
Replace the cancer-cell mass with injured parenchymal cells, keep the vessel, the oxygen gradient and the shift from loose to stiff matrix, and call the fibroblasts myofibroblasts, and the figure serves as a schematic of organ fibrosis. The cytokine stars can then stand for profibrotic signals.