Figure template · Cross-section · 4:3
Intact Versus Disassembled Cytoskeleton Figure
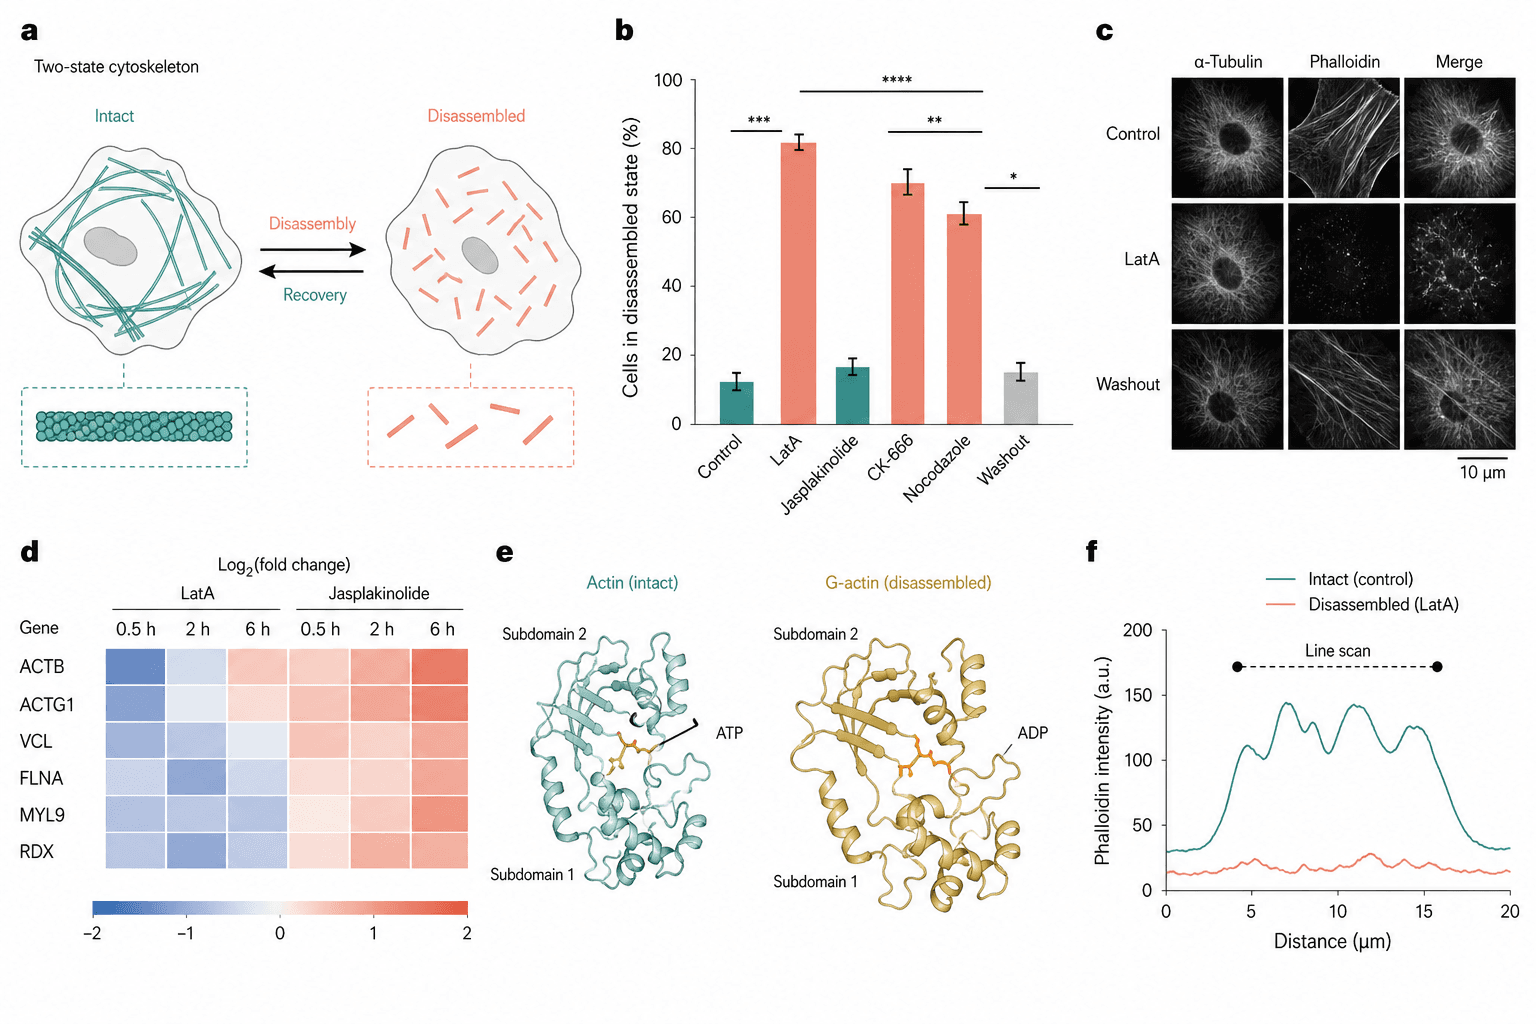
Two cells open the page as an intact filament network and a field of short fragments joined by reversible arrows, and five quantitative panels then measure that contrast across drugs, imaging, time, monomer state and intensity.
Prompt
Create a scientific figure about: Intact versus disassembled cytoskeleton with quantitative readout. Visual style: Clean Vector. Requirements: publication-ready scientific quality, clear labels and directional arrows where appropriate, avoid cartoon or stock-photo look, composition optimized for research papers and academic slides.
What this template is
The page is about two states of one filament system and the transition between them. The schematic pairs a continuous network with disassembled fragments and marks both directions, so the process reads as reversible rather than terminal. A bar chart then compares how many cells sit in the disassembled state under each drug, with a washout condition at the end, fluorescence images show the morphology behind those numbers, a heatmap follows gene expression over time, and a monomer pair and a line scan close the argument at the molecular and the intensity level.
Elements to label
Two-state schematic
Panel a sets an intact network beside a fragmented one, each cell carrying its own zoomed filament detail below it.
Reversible arrows
Arrows between the two cells name disassembly and recovery, each one drawn in the colour of the state it leads to.
Disassembly bar chart
Panel b plots the percentage of cells in the disassembled state, for control, for each drug and for the washout.
Significance brackets
Stacked brackets with stars sit above the bars, spaced well apart, with the star notation itself defined in the caption.
Fluorescence matrix
Panel c runs the treatments down the rows and two stains plus their merge across the columns, with a scale bar.
Expression heatmap
Panel d puts the genes in rows and three time points per treatment in columns, on a symmetric diverging scale.
Monomer conformations
Panel e shows two actin monomers side by side bound to different nucleotides, with their subdomains both labelled.
Line scan
Panel f plots fluorescence intensity against distance, one trace for the intact state and one for the disassembled state.
Where it is used
- Paper mechanism figure
- Graphical abstract
- Defense slides
- Course handout
What reviewers look for
Two filament systems are mixed
The schematic draws one kind of filament while the bar chart includes drugs acting on actin and others acting on microtubules, and the imaging uses two different stains. Say in each panel which system is being disassembled.
A stabiliser is coloured as a disruptor
One compound in the chart stabilises filaments and sits close to control, yet it carries the same colour as the depolymerising drugs, so readers take it for another destructive treatment.
How is disassembly scored
The axis counts cells in a disassembled state without giving the threshold, the scoring method or the number of cells per group, and every significance mark in the panel depends on those three.
The monomer pair lacks states
The two monomers carry different nucleotides, which is the distinction between polymerisation-competent and spent subunits, yet only the ligands are named and neither state is written anywhere.
How to use it in Yila
- 1Pick a figure
- 2Describe your subject and the steps to stress
- 3Refine it in chat, then download the PNG
Tips
Do
- State in the schematic which filament system is drawn, and keep every drug and stain in the other panels to it.
- Always put the washout bar last and colour it like the control, so reversibility is visible without reading the axis.
- Match the rows of the fluorescence matrix to the key treatments in the bar chart, so the two panels read together.
Avoid
- Do not stack the significance brackets so tightly that they merge into one band once the figure has been reduced.
- Do not mix two intensity scales in one figure; the line scan and the images ought to corroborate each other visually.
Questions
Can this go straight into a paper?
Use it as a layout reference. The bar heights, the heatmap and the line scan are AI-generated illustration, so replace them with your own measurements, settle which filament system the page is really about, and add the scoring threshold and the cell counts before refining it further in Yila.
Can elements in the figure be changed?
Not element by element, but you can keep refining it by chatting in Yila: swap in the compounds you actually used, remove the monomer panel, shorten the heatmap to fewer genes, or keep only the schematic and the bar chart, then generate a new version from that description.
What format is delivered?
An AI-generated PNG image in a 4:3 landscape layout. It is not a vector graphic, so the heatmap row names and the scale bar on the images soften once the figure is reduced; check it at your own column width before placing it in the text.
Is it free?
Viewing this page and the sample figure costs nothing. Generating a version in Yila consumes credits, and a new account receives 2,500 credits, which is enough to bring the panel set, the drug names and the palette into line with your own experiment.
I study intermediate filaments. Does this layout still work?
Yes. The intact-versus-fragmented schematic transfers directly; replace the compounds with your own treatments and the stains with the matching antibodies. If you have no equivalent of the monomer panel, it is safer to drop that block entirely than to leave it unexplained.
Can I keep only the schematic and the bar chart?
Ask for those two panels side by side and drop the imaging, the heatmap and the monomer block. Together they already say that treatment drives cells into the disassembled state and that washout brings them back, which is about enough for one slide.