
How to Quickly Create a Publication-Quality Scientific Figure with Yila
A practical guide to creating publication-quality scientific figures with Yila, from source-material upload and visualization confirmation to revision and editable exports.
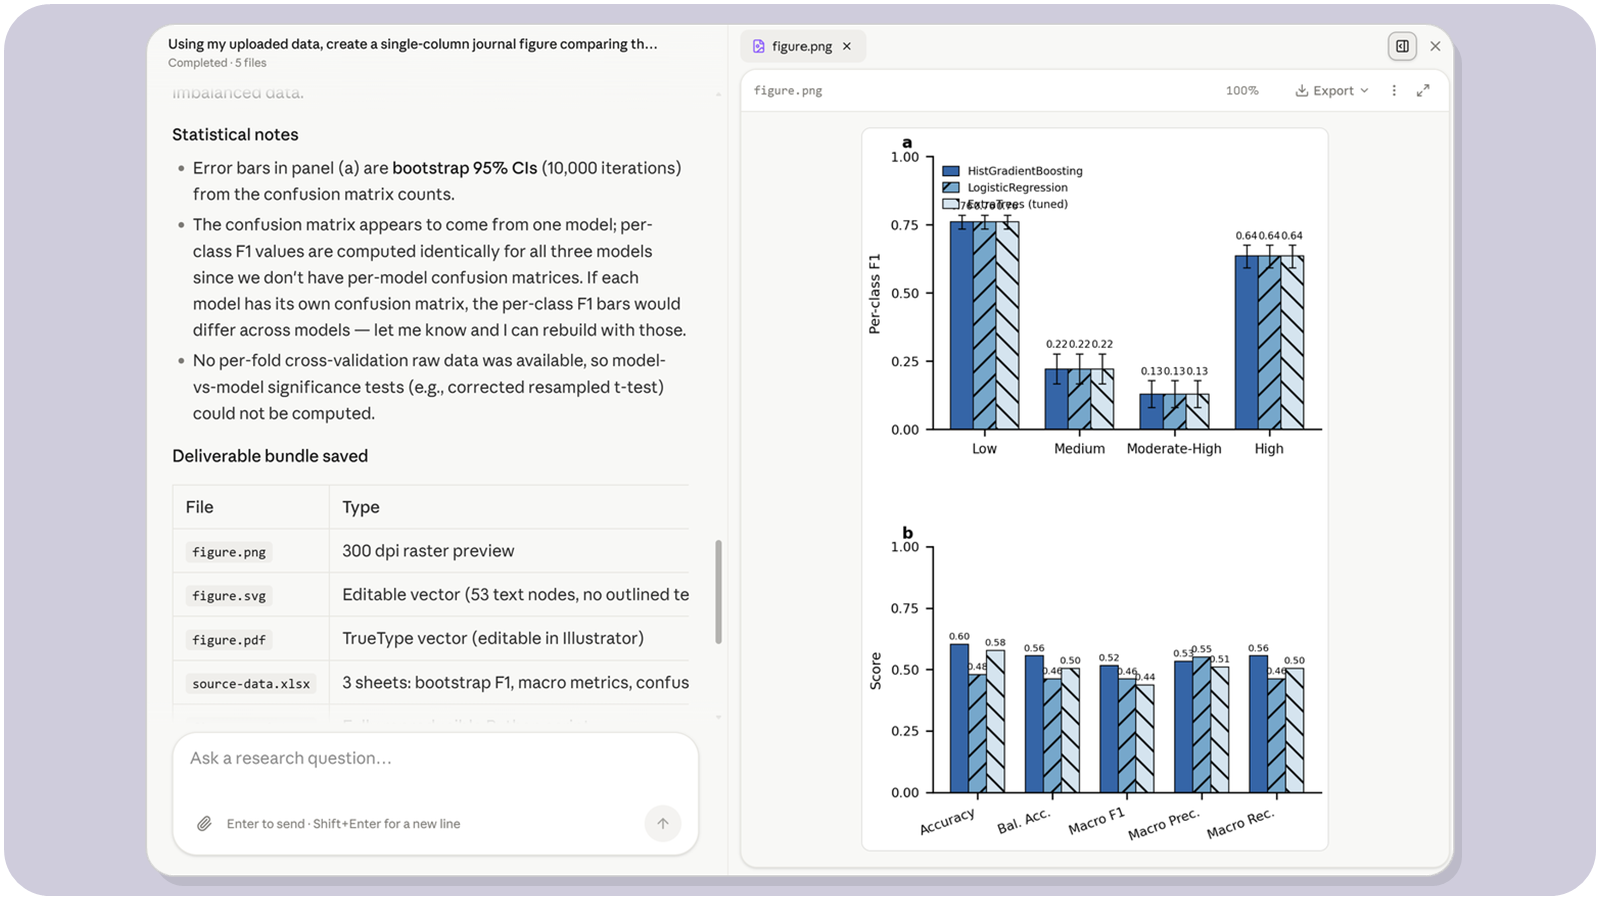
A scientific figure is not effective simply because it looks good. A publication-quality figure should help readers quickly understand what the study compares, what the most important findings are, and whether the evidence is reliable.
Yila Scientific Figure first understands the scientific conclusion you want to communicate, then selects an appropriate visualization method based on your materials. You can create data figures, multi-panel composite figures, redraw existing figures, or produce mechanism diagrams, experimental workflows, and conceptual models. Even without experience in plotting software, you can start with one clear sentence.
Quick Start in 3 Minutes
Step 1: Upload Your Materials and Explain What You Want to Show
Prepare two things before starting:
- Your materials: Excel or CSV data, existing charts, an old figure from a paper, a results table, or a written description of a mechanism or workflow.
- One core instruction: explain the conclusion the figure should communicate.
For example:
Using my uploaded data, create a single-column journal figure comparing the main results of three treatment groups. Show the raw data points, error ranges, and statistical significance, and retain the reproducible script and source data.
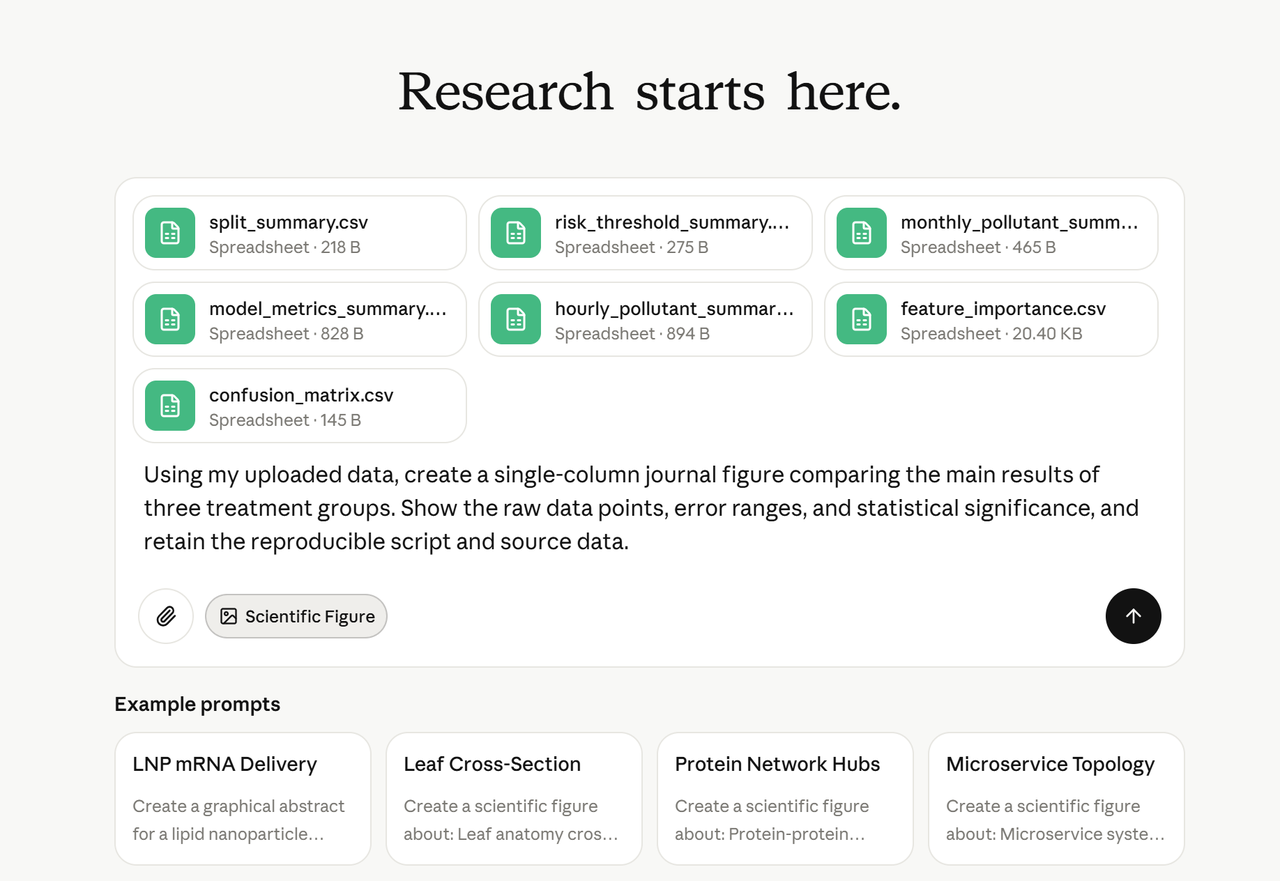
The instruction does not need to specify every visual detail. Start with the scientific message, comparison groups, and essential evidence. Yila can clarify the chart type, layout, and export requirements when needed.
Step 2: Confirm the Visualization Method and Click Start
Before generation, confirm the proposed visualization method. Check whether the selected chart type, panel structure, variables, grouping, color logic, statistics, dimensions, and output formats match the intended publication.
For data figures, confirm the source columns, units, summary method, error bars, and statistical annotations. For mechanism diagrams or workflows, confirm the entities, relationships, direction of flow, and required labels.
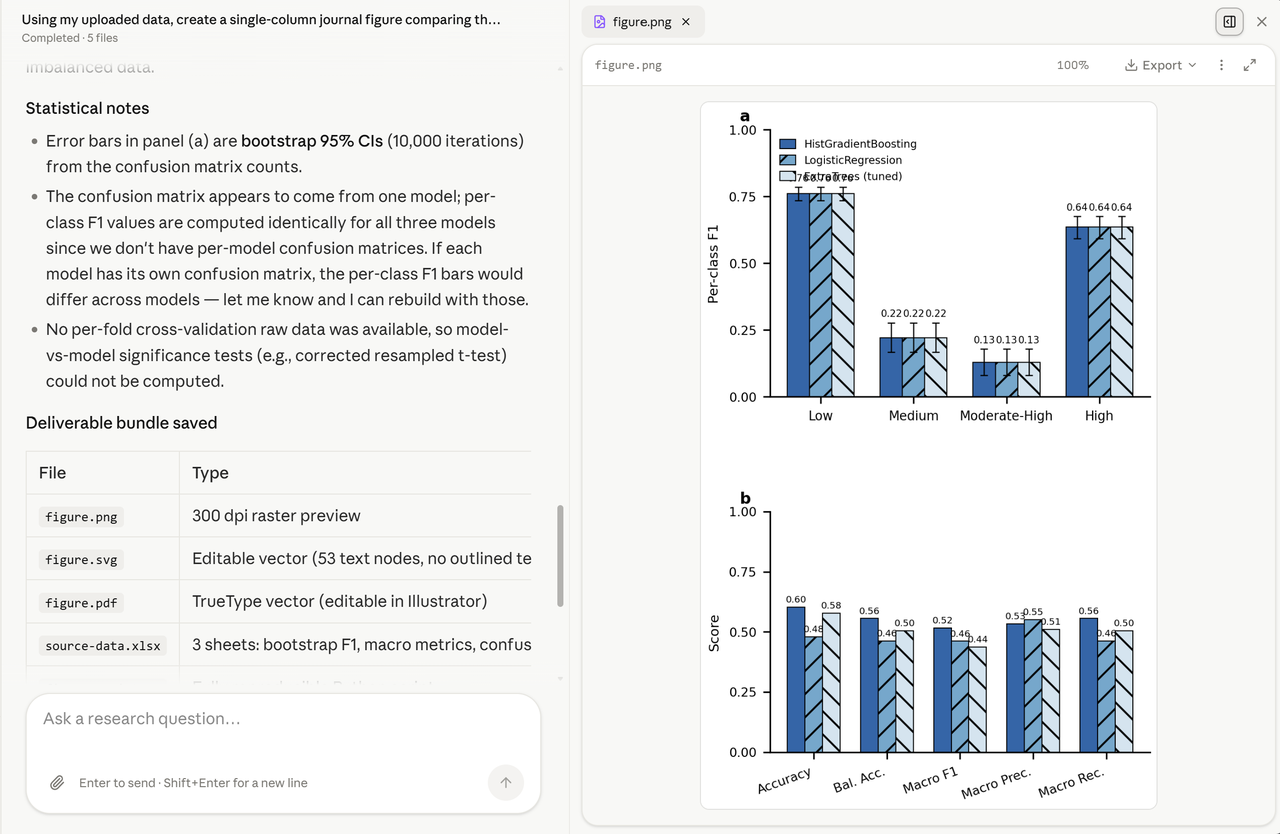
After these details are correct, start the task. Yila will generate the figure while retaining the information needed for reproducibility and later editing.
Step 3: Review, Revise, and Download the Results
After generation is complete, first check whether the preview accurately communicates the core conclusion. Then inspect the title, axes, legend, panel labels, colors, and statistical information. If changes are needed, describe them directly in natural language.
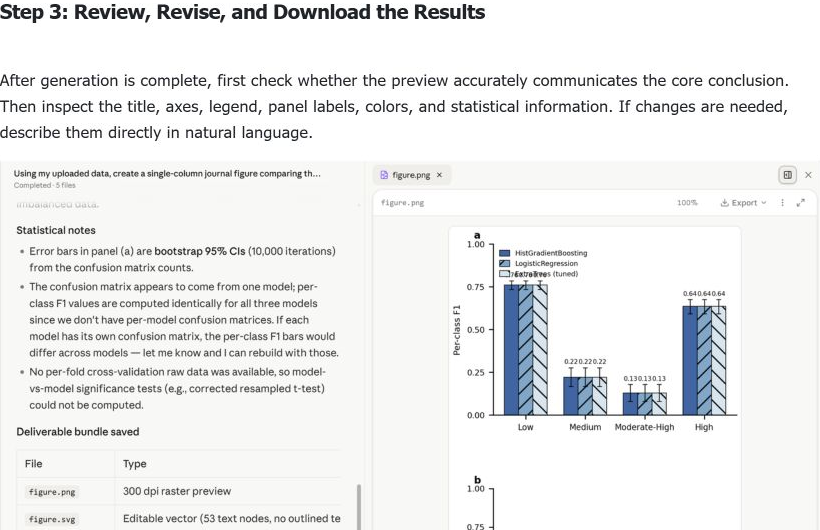
For example:
Enlarge panel b, reduce the space occupied by the legend, and make the main treatment group easier to distinguish from the control group while keeping the data and statistical results unchanged.
Download the deliverables required by your workflow. Depending on the task, these may include a high-resolution PNG, an editable SVG or PDF, the plotting script, and the organized source data.
How to Write Better Instructions
The most useful instruction describes the scientific goal before the visual style. Include the data or source material, the comparison to emphasize, the intended publication context, and any non-negotiable statistical or export requirements.
1. Create a Data Figure
Create a journal-ready figure from the uploaded dataset. Compare the treatment and control groups, display individual observations and 95% confidence intervals, label the axes with units, and export an editable vector version with the reproducible script.
2. Create a Multi-Panel Composite Figure
Combine the uploaded plots into a coherent four-panel figure labeled a-d. Use consistent typography, axes, spacing, and colors. Align the panels to a two-column journal width and preserve all original values and statistical annotations.
3. Redraw an Existing Scientific Figure
Redraw the uploaded low-resolution figure as an editable vector graphic. Preserve the data, labels, symbols, and scientific meaning, but improve alignment, typography, line weight, and visual hierarchy.
4. Create a Mechanism Diagram or Experimental Workflow
Create a mechanism diagram showing the relationship among the uploaded components. Use clear directional arrows, concise labels, and a left-to-right flow. Confirm the scientific relationships with me before generating the final illustration.
Core Advantages of Yila Scientific Figure
- Starts from the scientific message: The workflow focuses on the conclusion and evidence before choosing a chart style.
- Supports varied source materials: Use tabular data, old figures, results tables, written descriptions, and mixed reference materials.
- Covers multiple figure types: Create data plots, multi-panel figures, redraws, mechanism diagrams, workflows, and conceptual models.
- Produces editable deliverables: Export high-resolution raster previews and editable vector formats when the task supports them.
- Preserves reproducibility: Keep the plotting script and organized source data together with the final figure.
- Supports natural-language revision: Request targeted changes without manually rebuilding the full figure.
Frequently Asked Questions and Additional Notes
1. Can I use it without any plotting experience?
Yes. Explain what the figure should communicate and upload the available materials. Yila can propose a visualization method and ask for confirmation before generation. You should still review the scientific accuracy of the final result.
2. What is the difference between a data figure and a mechanism diagram?
A data figure visualizes measured or calculated values, such as distributions, trends, comparisons, correlations, or uncertainty. A mechanism diagram explains entities, relationships, processes, or hypotheses. The first depends on data and statistics; the second depends on a correct conceptual structure.
3. What types of scientific illustrations are supported?
Typical tasks include statistical plots, time series, heatmaps, scatter plots, multi-panel composites, redesigned legacy figures, mechanism diagrams, experimental workflows, conceptual models, and graphical summaries. Suitability depends on the quality and completeness of the supplied materials.
4. How should I choose between Python and R?
Use the environment that best matches your existing workflow and required libraries. If there is no preference, describe the desired output and reproducibility requirements; Yila can choose an appropriate implementation. Always retain the script and environment notes for later reproduction.
5. I only have an old figure and no raw data. Can it still be redrawn?
Yes, if the goal is to improve clarity or create an editable version while preserving visible information. Without raw data, Yila should not invent missing values or claim statistical precision that cannot be recovered. Clearly distinguish visual reconstruction from data re-analysis.
6. Can it create multi-panel figures?
Yes. Upload the component figures or source data and specify the panel order, labels, target width, and shared visual rules. Confirm that axes, scales, legends, and statistical annotations remain comparable across panels.
7. Can I specify journal dimensions and export formats?
Yes. Provide the target journal, single- or double-column width, required resolution, color mode, font constraints, and export formats. When requirements are strict, attach the latest author guidelines.
8. Which submission details does the system check?
The workflow can help check dimensions, resolution, labels, fonts, line weights, panel organization, legends, colors, and requested file formats. The journal's latest guidelines and the author's scientific review remain the final authority.
9. Why is confirmation required before generating a mechanism diagram?
Mechanism diagrams encode scientific claims rather than only visualizing supplied values. Confirming entities, relationships, causal direction, and uncertainty reduces the risk of producing a polished but scientifically incorrect diagram.
10. How can I revise the result after generation?
Describe the specific element and desired change. For example: enlarge a panel, move a legend, adjust the color contrast, correct a label, or change the export size. State which data, statistics, and scientific relationships must remain unchanged.
11. What should I keep in mind when uploading materials?
Use clear filenames, include units and variable definitions, identify grouping columns, explain missing values, and provide the original high-resolution assets. For statistical figures, state how uncertainty and significance should be calculated. Do not rely on screenshots when source data are available.
12. How long does a task take?
Timing depends on the number of panels, source quality, statistical complexity, illustration type, revision rounds, and export requirements. A straightforward data figure may be completed quickly, while a complex mechanism diagram or multi-panel reconstruction requires more review.
Summary
Creating a publication-quality scientific figure with Yila follows three steps: upload the materials and explain the scientific message, confirm the visualization method, then review, revise, and download the deliverables.
The best results come from clear source materials and an instruction focused on the conclusion the reader should understand. Always verify the data, statistics, labels, and scientific relationships before submission, and keep the editable figure, source data, and reproducible script together.