
How to Quickly Complete a Reliable Data Analysis with Yila
A practical guide to using Yila for reliable data analysis, from data upload and method review to result interpretation, chart revision, and reproducible exports.
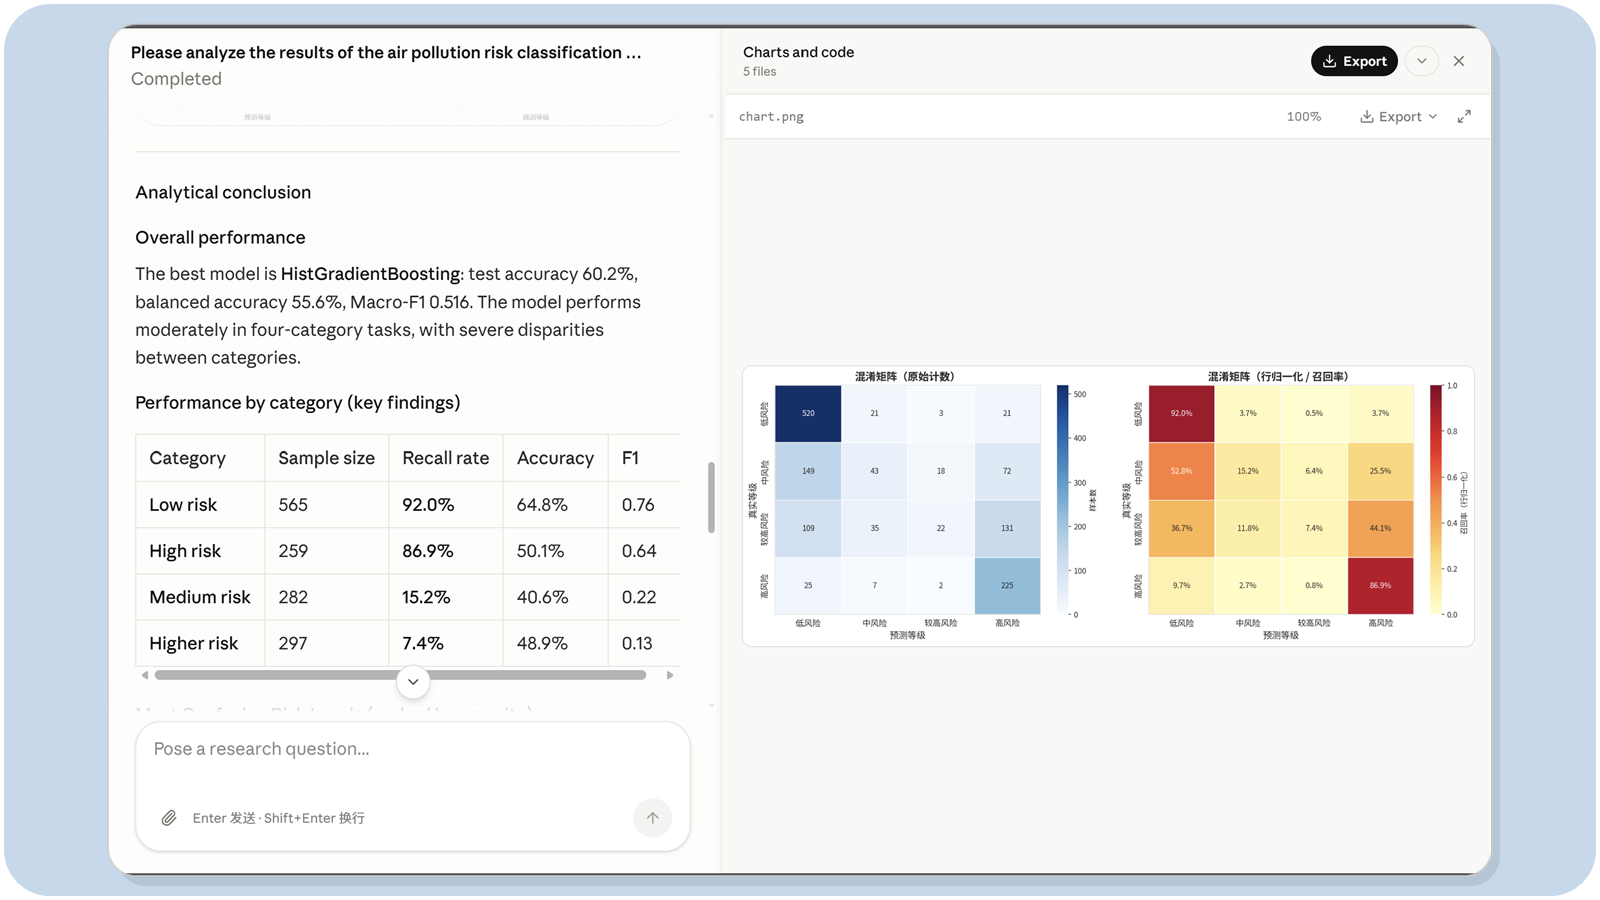
The hardest part of working with data is often not creating a chart, but determining whether the data is reliable, which method to use, and what the results actually mean. Without checking field types, missing values, sample size, and statistical assumptions, even an attractive chart may support unreliable conclusions.
Yila Data Analysis reads CSV and XLSX files. You can ask it to inspect the data first or begin with a research question. Yila selects an appropriate preview, statistical analysis, or visualization workflow and delivers result tables, professional charts, and reusable scripts. You can complete an analysis in natural language without knowing Python or R.
This guide explains how to begin in two simple steps. Data preparation, statistical methods, missing values, P values, specialized charts, and result validation are covered in the FAQs.
Quick Start in 2 Minutes
Step 1: Upload Your Data and State the Question
Upload a CSV or XLSX file, then describe what you want to know in one sentence. For example:
- Does this dataset have any obvious quality problems?
- Is there a difference between the two groups?
- Are two numerical variables correlated?
- Do the survival curves differ between groups?
- Which genes meet the specified differential-expression thresholds?
If you are unsure what to analyze, you do not need to learn statistical methods first. Select "Inspect Data First" or leave the request blank. Yila will examine the dimensions, fields, first rows, missing values, and basic distributions, then recommend a useful next step.
Python is used by default. Request R only when your team's workflow specifically requires it. You do not need to write code yourself.
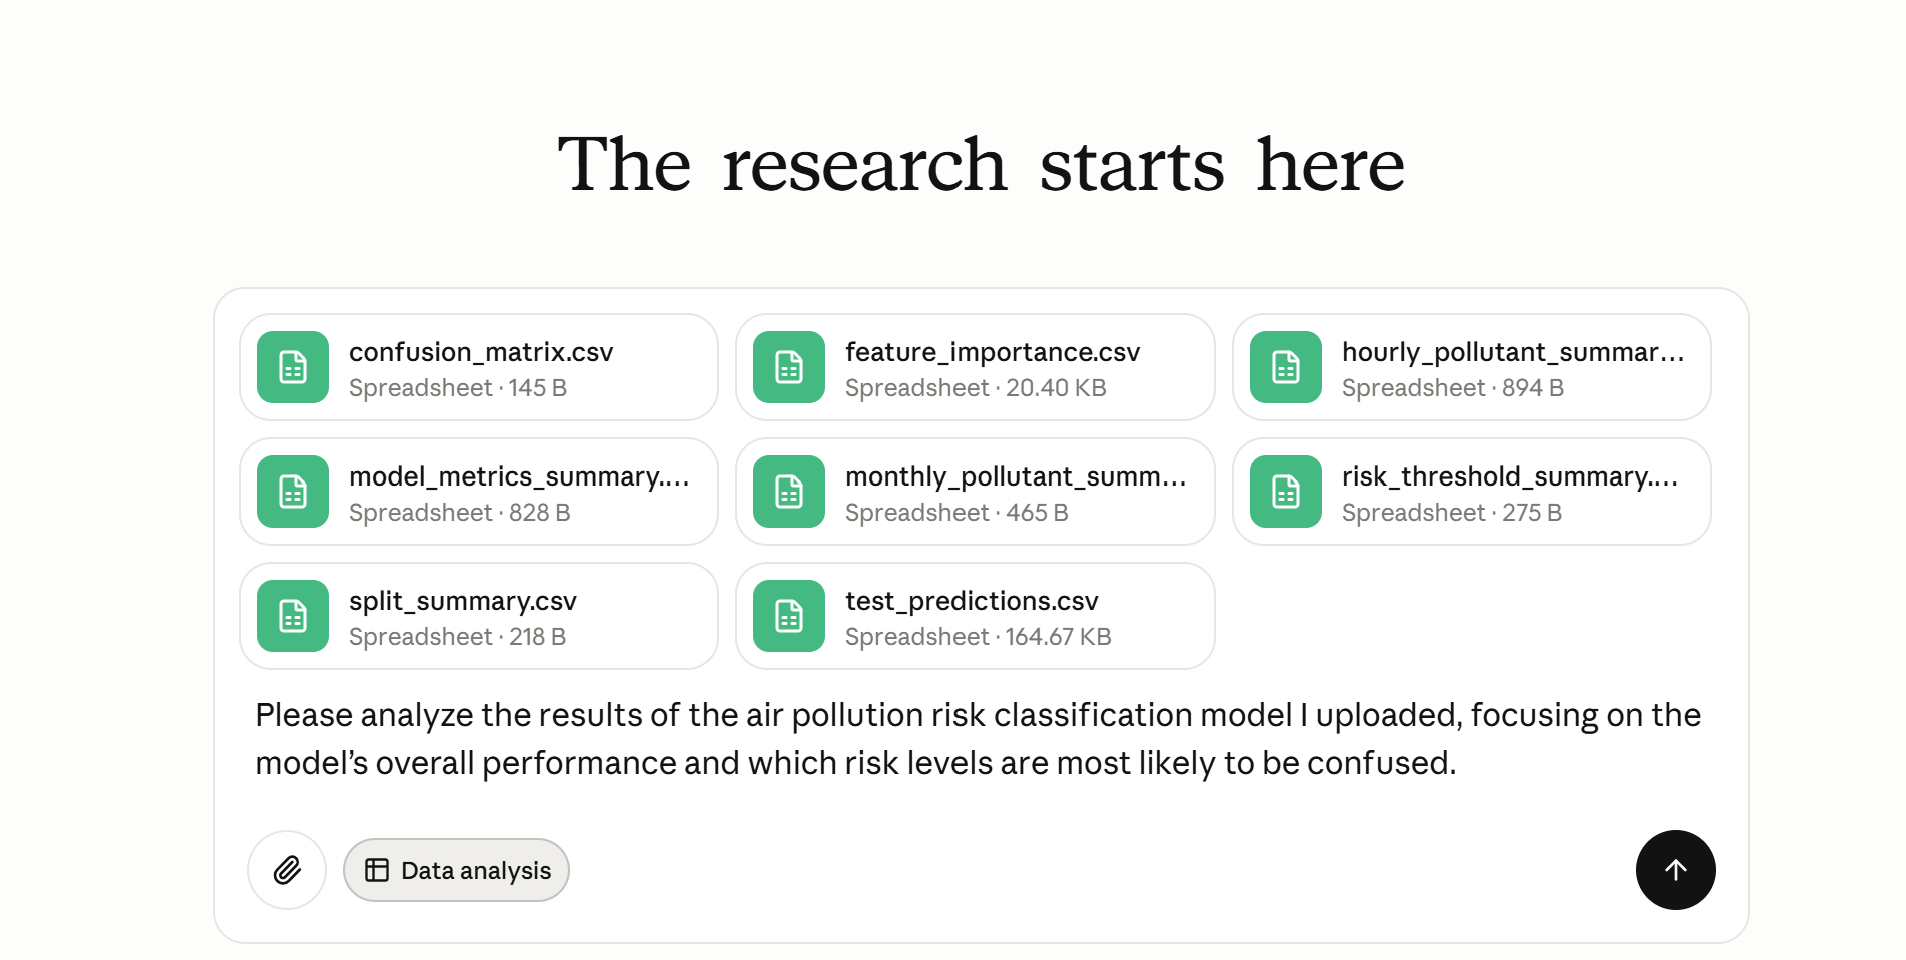
Step 2: Review the Explanation and Download the Results
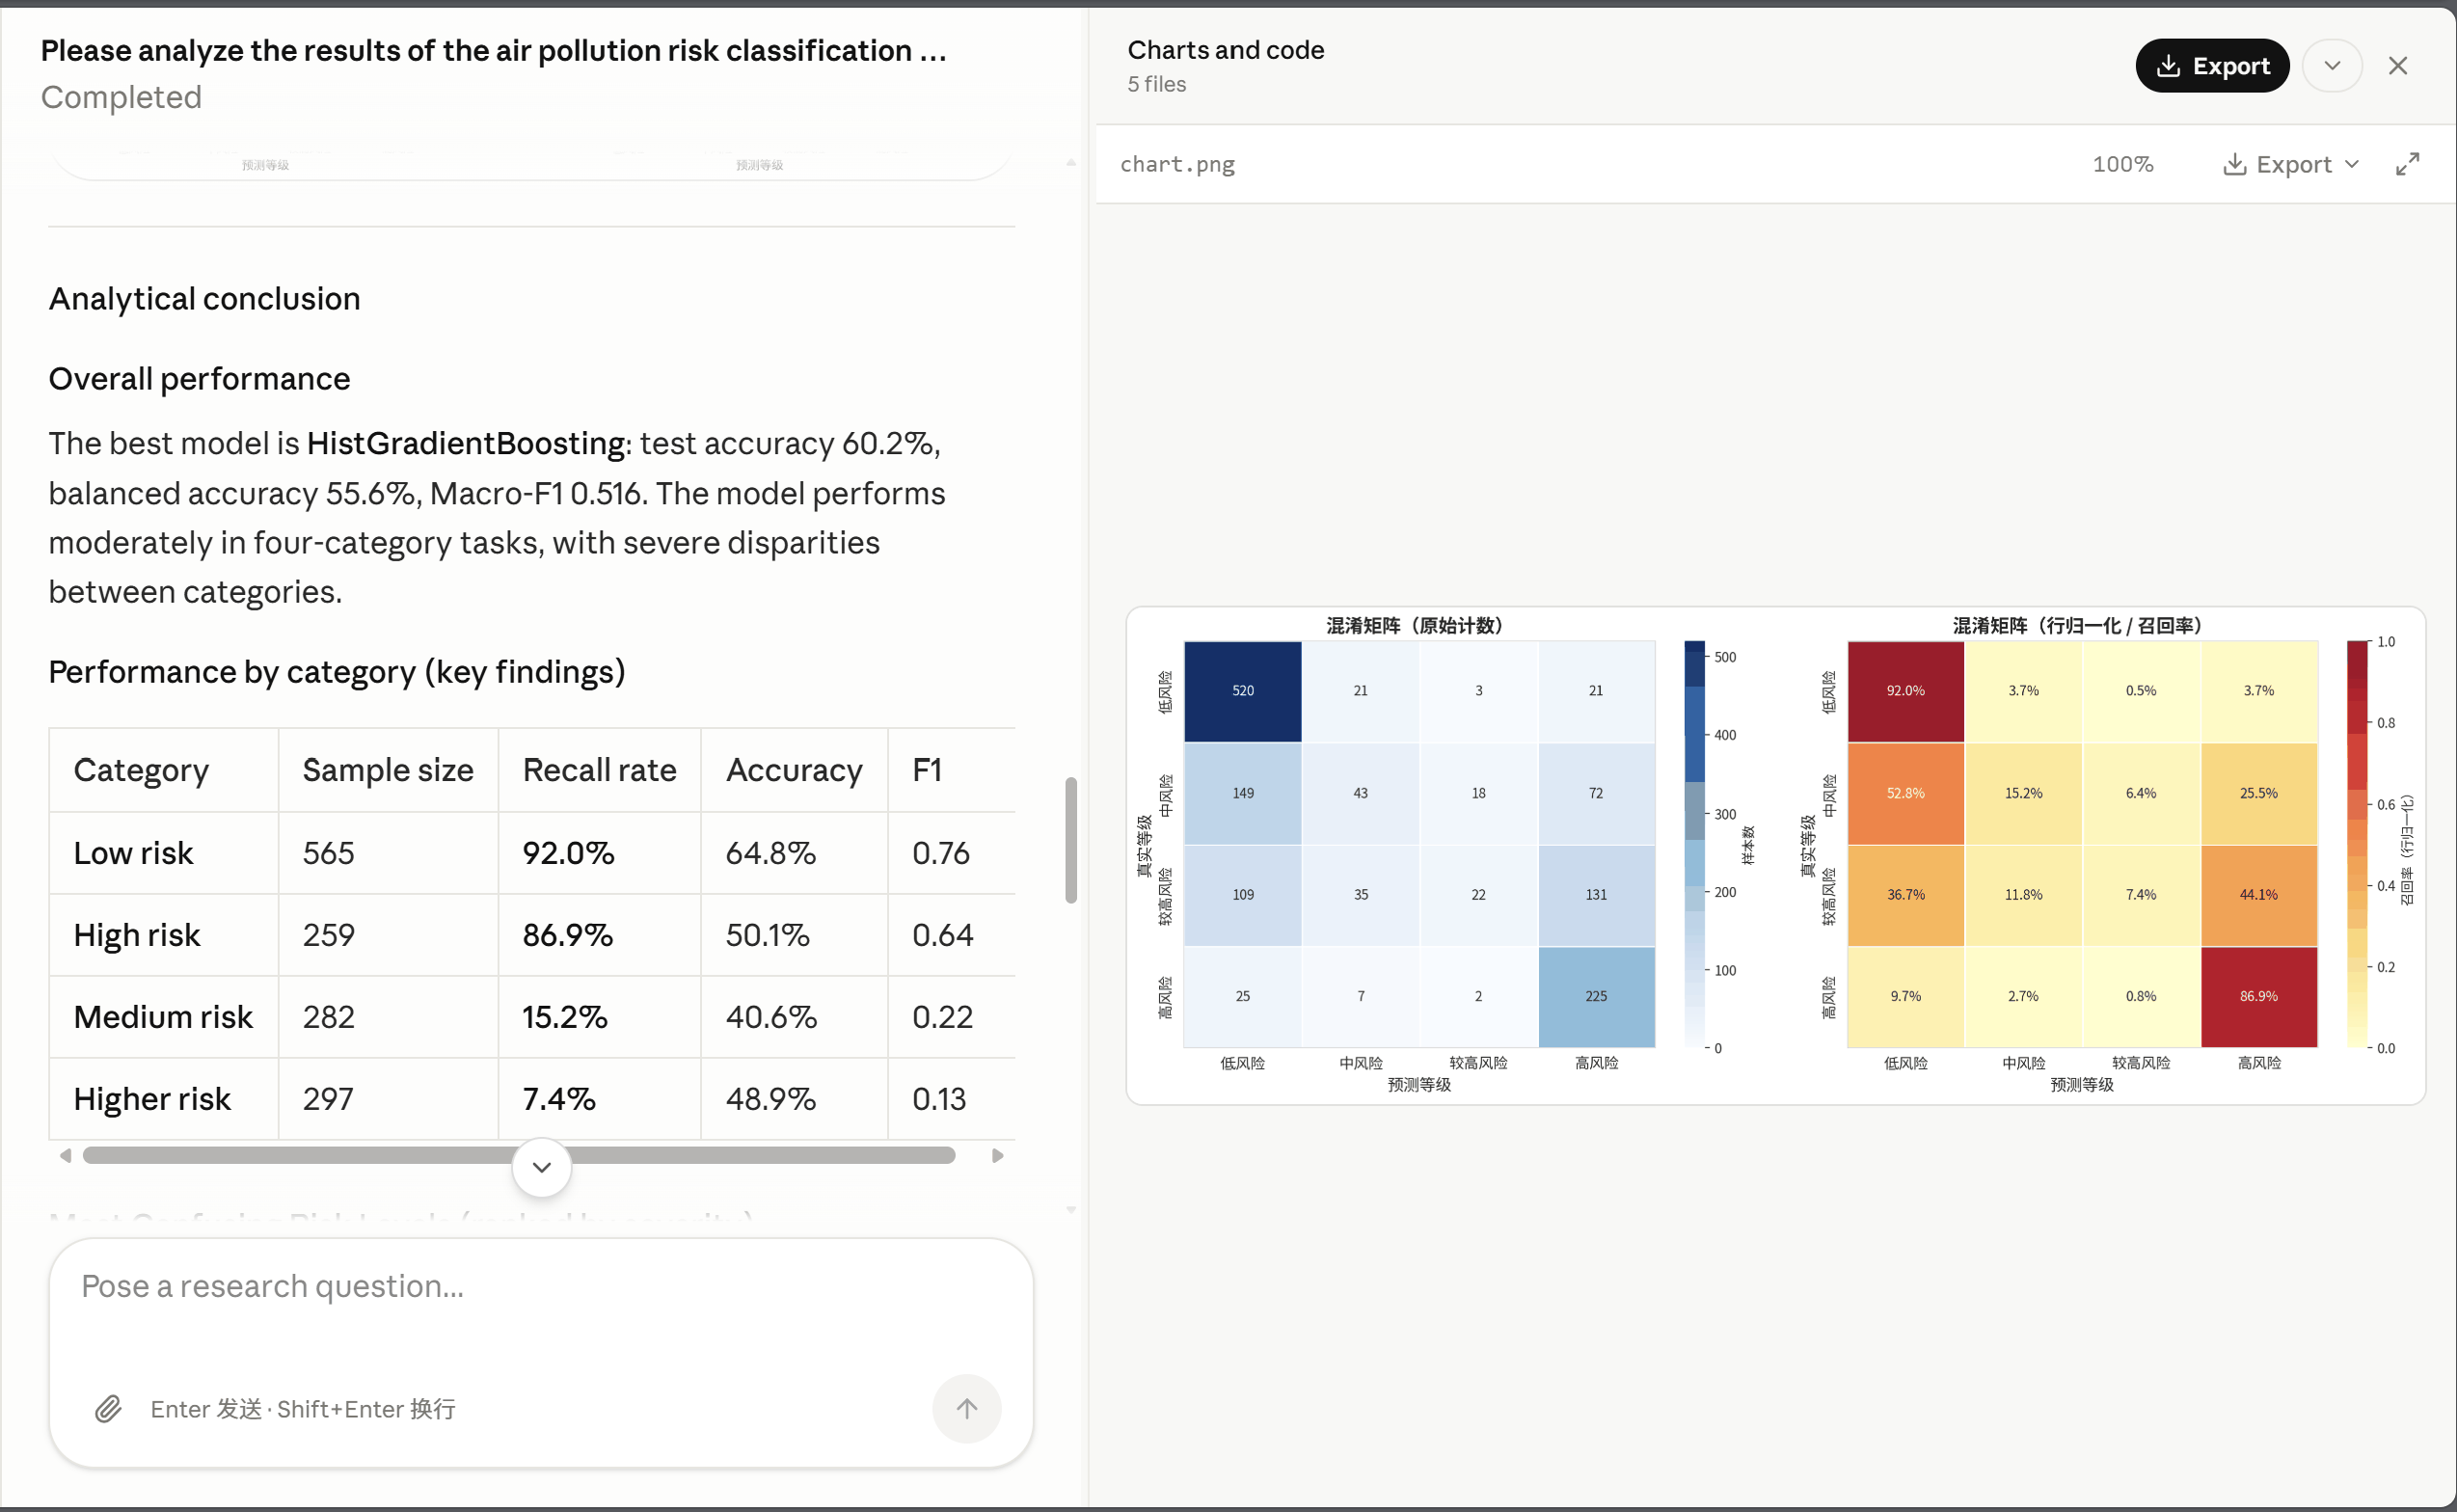
After analysis, read the method explanation before reviewing the result tables and charts. For statistical analyses, confirm:
- Which method was used and why
- The total sample size or sample size per group
- Which variables or groups were compared
- Uncertainty, P values, or other statistics
- Whether the chart agrees with the table and written interpretation
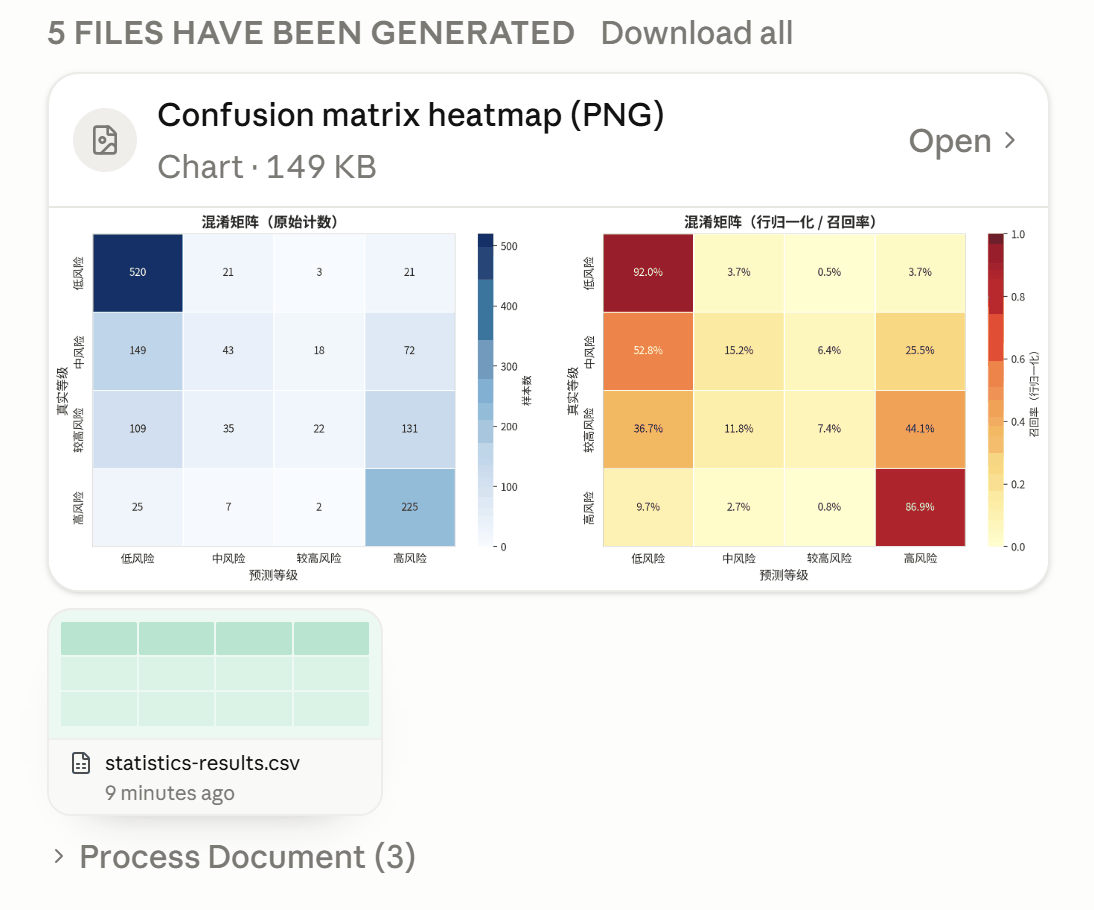
A complete analysis usually provides:
analysis-data.csv: the data actually used in the analysis.statistics-results.csv: statistical or summary results.chart.png: a ready-to-use chart.chart.svg: an editable vector chart, when available for the task.analysis_script.py: a reusable analysis script.
To make revisions, state what should change and what must remain unchanged. For example: "Change the chart to a box plot with raw data points and a color-blind-friendly palette, while keeping the statistical method and sample unchanged."
How to Write More Accurate Analysis Requests
The most useful format is: research question + key fields + groups or comparison + desired output. Include important thresholds or constraints when known.
1. Inspect the Data First
First audit this CSV/XLSX file. Report the sample size, field types, and missing values; provide basic statistics; identify data-quality issues that may affect analysis; and recommend the most useful next question.
2. Compare Multiple Groups
Compare IL-6 across the three treatment groups. Check the distributions, choose an appropriate multi-group test and post-hoc comparisons, report each group's sample size and P value, and create a box plot with raw data points.
3. Analyze the Relationship Between Two Variables
Examine the relationship between age and score. Explain whether Pearson or Spearman correlation is appropriate, report the valid sample size and correlation coefficient, and create a scatter plot.
4. Perform Survival Analysis
Use the time, status, and group columns for survival analysis. Draw Kaplan-Meier curves, perform a log-rank test, and report sample size, event count, and P value for each group.
5. Create a Volcano Plot
Create a volcano plot from gene, log2FoldChange, and padj. Use |log2FC| >= 1 and padj < 0.05, label the 10 genes with the largest changes, and export the filtered results.
6. Revise an Existing Chart
Change the chart to a box plot with raw data points, consistent fonts, and a color-blind-friendly palette. Keep the included samples, statistical method, and numerical results unchanged.
Core Advantages of Yila Data Analysis
- Starts with data-quality checks: examines structure, field types, missing values, and distributions before analysis.
- Begins with one research question: no need to choose a test or write code first.
- Handles open and specific questions differently: inspect unfamiliar data first, or run a focused analysis when the question is clear.
- Explains methods and reasoning: reports why a method was selected, sample sizes, comparisons, and uncertainty.
- Supports common research charts: bar charts, box plots, histograms, scatter plots, line charts, heatmaps, correlation matrices, Kaplan-Meier curves, and volcano plots.
- Delivers reusable files: analysis data, statistical results, charts, and scripts accompany the explanation.
Frequently Asked Questions and Additional Notes
1. Can I use it without knowing Python or R?
Yes. Upload the data and describe the question in natural language. Yila uses Python by default and saves the script; it uses R only when explicitly requested. You do not need to code, but should still read the method explanation and verify that the result fits the study design.
2. Which file formats are supported?
The Data Analysis entry currently focuses on CSV and XLSX. Ideally, each row represents a sample or observation, each column represents a variable, and the first row contains clear, unique field names. For complex workbooks, extract the relevant sheet and minimize merged cells, decorative headings, and blank rows.
3. How should I prepare data before uploading?
Standardize dates, units, group names, and missing-value notation. Do not mix numbers and explanatory text in one column. Use consistent codes for categorical variables and retain a backup of the raw data. Field names should be short but meaningful, such as group, age, score, time, and status.
4. What if I do not know which analysis to run?
Select "Inspect Data First," or ask Yila to report dimensions, fields, first rows, missing values, and basic statistics. After the audit, choose the next step based on the research question, variable types, and data quality.
5. Does Yila automatically handle missing values and outliers?
It can identify and report missingness and suspicious distributions, but should not delete or impute data without instructions. These decisions affect conclusions. Specify rules when treatment is required, and record the actual sample size and method in the results.
6. Should I choose "Inspect Data First" or "Statistical Test"?
Inspect first when the question is open, the structure is unfamiliar, or quality is uncertain. Run a statistical test directly when the outcome, grouping variables, and comparison are clear. A focused task will not begin with an unrelated full exploratory analysis.
7. How is the statistical method selected?
Selection depends on study design, variable type, number of groups, distribution, sample independence, and relevant assumptions. The result should state the method and reason. Multi-group comparisons may require post-hoc tests and multiple-testing correction.
8. How should I interpret a P value?
A P value alone does not represent effect size, practical importance, or causality. Also examine sample size, direction and size of effect, confidence intervals, or other uncertainty measures. Do not interpret P > 0.05 as proof that two groups are identical.
9. Can correlation prove causation?
No. A correlation coefficient describes association and does not show that one variable causes another. Confounding, measurement, temporal order, and study design all affect interpretation.
10. Which fields are required for survival analysis?
Usually follow-up time, outcome status, and group are required. Specify which status value represents an event and ensure time units are consistent. Mention censoring, competing risks, or complex stratification when relevant.
11. Which fields are required for a volcano plot?
Usually an item or gene name, an effect size such as log2FoldChange, and a significance field such as P value or adjusted padj. Specify thresholds, how many labels to show, and whether to use raw or adjusted P values.
12. Can I specify the chart type?
Yes. Choose a bar chart, box plot, histogram, scatter plot, line chart, heatmap, correlation matrix, Kaplan-Meier curve, volcano plot, or "Auto." The chart should serve the research question and data structure, not merely visual preference.
13. Why is chart.svg sometimes missing?
SVG is an editable vector format. If an SVG fails file-standard validation, the task may retain only valid PNG, CSV, and script files and explain this in the result. Missing SVG does not affect saved statistical results.
14. How is analysis-data.csv different from the raw data?
analysis-data.csv contains the data actually used in the analysis and may include only relevant fields or records processed under explicit rules. It supports reproducibility but does not replace the raw data. Save the original file, processing rules, analysis data, and script together.
15. Can the results be copied directly into a paper?
The interpretation can support planning or drafting, but researchers must verify the design, sample selection, variable definitions, assumptions, values, units, and captions before publication. Medical, clinical, and other high-risk research also requires professional statistical review under team procedures.
16. What should I know about data privacy?
Follow your institution's and project's data-management rules. Remove direct identifiers before uploading patient, participant, student, customer, or unpublished research data, and assess whether combinations of fields could still identify individuals. Do not upload data you are not authorized to process.
17. How long does an analysis take?
Simple previews, summaries, and charts are usually quick. Complex statistics, survival analysis, large files, or unclear fields take longer. Follow the progress shown on the task page.
18. How is Data Analysis different from Scientific Figure?
Data Analysis answers questions by checking quality, selecting statistical methods, calculating results, and explaining uncertainty. Scientific Figure focuses on turning established data and conclusions into publication-quality visuals. Use Data Analysis first when the conclusion is not yet established; use Scientific Figure when the statistics are final and the main task is redrawing or combining panels.
Summary
Using Yila for data analysis takes three steps: upload a CSV/XLSX file, write one sentence describing what to analyze, then review the results and download the tables, charts, and script.
For your first task, you do not need to choose a statistical test or chart type in advance. Let Yila inspect the fields and missing values, then continue with one clear research question to obtain results that are verifiable, interpretable, and reusable.