قالب شكل علمي · سير العمل · 4:3
CRISPR Knockout Screen Workflow Figure
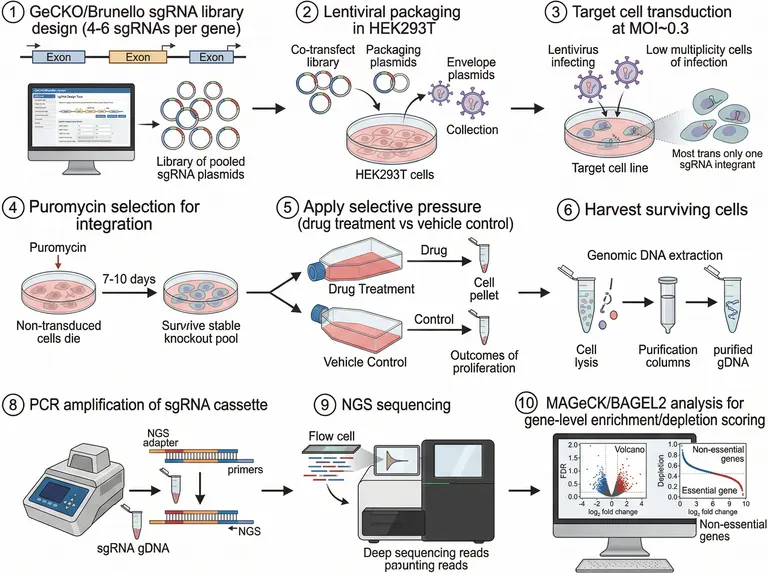
A numbered, landscape grid that walks a pooled genome-wide knockout screen from sgRNA library design and lentiviral packaging through transduction and drug pressure to genomic DNA extraction, amplicon sequencing and gene-level enrichment and depletion scoring.
الموجّه
Create a scientific figure about: CRISPR genome-wide knockout screen from sgRNA library design through transduction, readout, and hit validation. Visual style: Clean Vector. Requirements: publication-ready scientific quality, clear labels and directional arrows where appropriate, avoid cartoon or stock-photo look, composition optimized for research papers and academic slides.
ما هذا القالب
The figure splits one pooled knockout screen into numbered panels read left to right. A library of sgRNAs covering the exons becomes a plasmid pool, is packaged with the helper and envelope plasmids into lentivirus, and is transduced at a low multiplicity so most cells carry a single integrant. Antibiotic selection removes untransduced cells, the stable knockout pool splits into a treated and a vehicle arm, and the harvested cells give genomic DNA that is amplified across the sgRNA cassette and sequenced. The last panel turns read counts into gene-level enrichment and depletion scores. A reader should be able to name the input and the output of every panel.
العناصر التي يجب تسميتها
Library design panel
An exon map with the design interface beside a ring of plasmids, labelled clearly as the pooled sgRNA library rather than a single construct.
Lentiviral packaging
Library, helper and envelope plasmids co-transfected into the packaging cells, with the arrow leading on to the collected virus.
Low-multiplicity transduction
Virus added to the target dish, with a zoom panel stating that most surviving cells carry just one sgRNA integrant.
Antibiotic selection
Untransduced cells dying on one side, the stable knockout pool on the other, with the drug and the culture time between them.
Treated and vehicle arms
The treatment flask and the vehicle control flask stacked in line, each leading to its own cell pellet at the same scale.
Genomic DNA extraction
Lysis, column purification and purified genomic DNA in a single row, with the endpoint named rather than merely implied.
Amplification and sequencing
The sgRNA cassette amplified with sequencing adapters, then an arrow carrying on to the flow cell and the instrument.
Scoring panel
A volcano plot and a depletion curve at the end, with both axes named and the analysis tool spelled out beside them.
أين يُستخدم
- Paper mechanism figure
- Defense slides
- Academic poster
- Course handout
ما الذي يدقّقه المراجعون
State the transduction conditions
A low multiplicity of infection is what makes the screen interpretable, so the panel should carry the value you used and the number of guides per gene; without them the single-integrant claim cannot be judged.
Keep the control arm visible
Enrichment and depletion are both measured against the vehicle arm, so draw the two arms equally wide and side by side, and give the starting cell number and passage count in the legend.
Sequencing reads out counts
The sequencing panel reports guide counts rather than expression levels, so label the required coverage on the arrow; without it readers slide into reading the step as transcriptome sequencing of the pool.
Do not flip the statistics
A volcano plot puts fold change on the horizontal axis and significance on the vertical one, and the depletion curve falls across ranked genes, with axis labels matching the analysis your methods describe.
كيف تستخدمه في Yila
- 1اختر شكلًا
- 2صِف موضوع بحثك والخطوات التي تريد إبرازها
- 3حسّنه عبر المحادثة، ثم نزّل ملف PNG
نصائح
افعل
- Put your cell line, the selection drug and the days under pressure into the prompt so each panel heading carries real conditions.
- For a single-column methods figure, ask for the numbered panels to be folded into two rows so that each heading stays legible.
تجنّب
- Do not let the panel numbers skip or drift from your methods text; check the sequence and every arrow after generating.
- Do not crowd more than one statistics plot into the last panel; keep the single plot that carries your conclusion.
أسئلة شائعة
Can this go straight into a paper?
It works as a first draft of a methods schematic. Because it is an AI-generated raster image, confirm that the panel numbers run without gaps, that each heading matches a step in your methods, and that the axis labels on the final plots are right before you refine it further in chat.
Can I change elements in the figure?
Not element by element, but you can keep refining it by chatting in Yila: swap drug pressure for sorting or a survival screen, change the packaging cells, drop panels you do not need, or replace the final plots with the analysis you actually ran, then generate again.
What format is delivered?
An AI-generated PNG image in landscape with the panels laid out in a grid, suited to a methods figure, a poster column or a teaching handout. It is not a vector graphic, so the small in-panel type blurs when the figure is shrunk and should be checked at final size.
Is it free?
Browsing this page and viewing the sample cost nothing. Generating your own version in Yila consumes credits, and a new account receives 2,500 credits, which is enough to rework the screen conditions, the two arms and the scoring panel several times over.
I run an activation or interference screen. Does it fit?
Yes. Library, packaging, transduction, selective pressure and sequencing all stay the same; describe the perturbation as activation or interference, and replace the depletion curve with a plot that suits the direction of your own readout.
Can I show only the analysis half?
Ask for the extraction, amplification, sequencing and scoring panels alone and leave out the library design and virus production steps. The result is far less crowded and fits the slide where you explain the analysis itself.